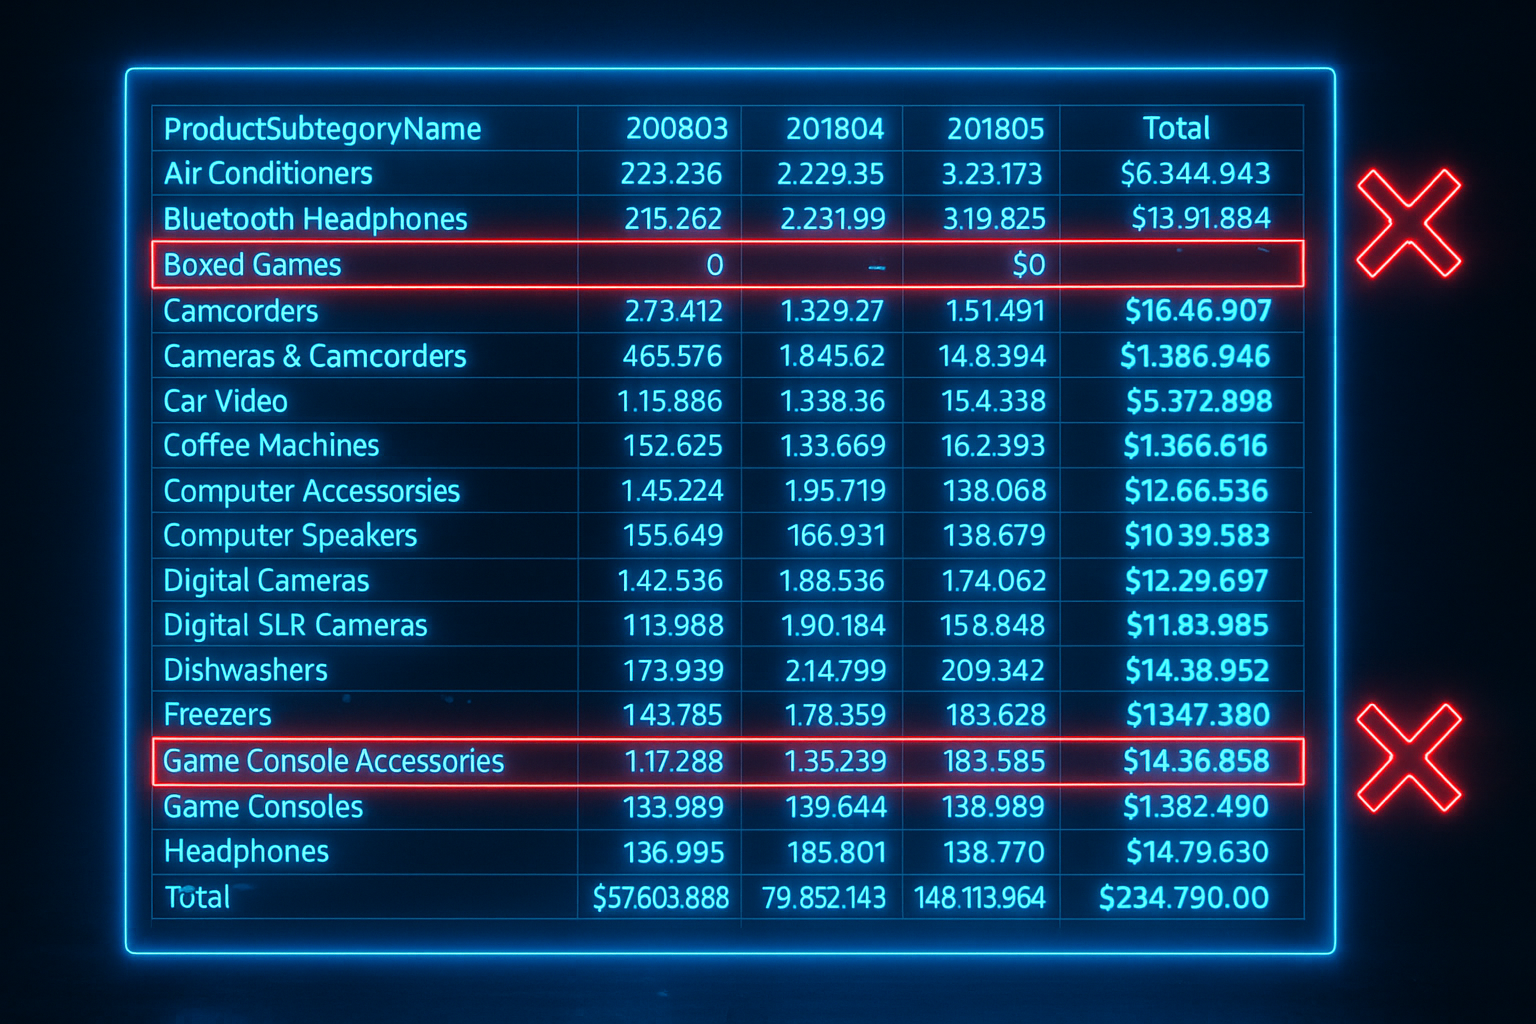
Introduction Why we would like to create Calculation Groups within our Data Model? Let’s just imagine that we’ve got a model containing several different Fact Tables that are doing a ...
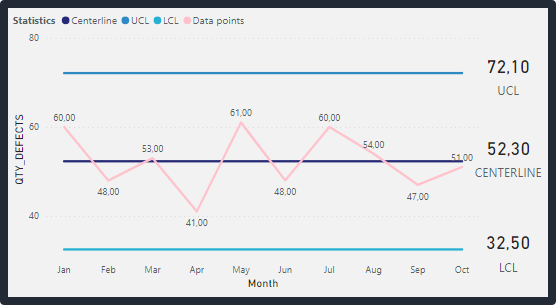
What is a Control Chart? A Control Chart is a statistical tool used in the field of process improvement, specifically in Lean Six Sigma methodology. It is used to monitor ...
Introduction A few weeks ago, I was reading a very interesting article about Data Visualization related to best practices and which charts to use in each situation. For those interested ...