How to build a Slope Chart using Native Visuals in Power BI

Introduction A few weeks ago, I was reading a very interesting article about Data Visualization related to best practices and which charts to use in each situation. For those interested…

Introduction A few weeks ago, I was reading a very interesting article about Data Visualization related to best practices and which charts to use in each situation. For those interested…

Introduction In this blog post, we will cover a technique used to remove undesired records from a matrix visual in Power BI. In fact, not only on matrix visuals, but…

Introduction In my opinion, Field Parameters was one of the best features Power BI has already released. It gives so much flexibility for developers build complex logics and complex interactions…

Introduction We all tend to avoid accessing super slow websites and apps. Back to the old days of the internet, somewhere in the mid 2000’s, websites that took too long…

Introduction A few months ago, an excellent youtuber name Bas Dohmen – founder of datatraining.io published an excellent video on youtube demonstrating a technique which can automatically select measures based on the user who…

Introduction In the current Data World, security is a hot trending topic in whenever place you go, in whichever event you attend and in every company working to leverage data…

Introduction Storytelling with Data is one of the greatest books for everyone who is working in the Data and Analytics field. Doesn’t matter if your job is more related to…

Introduction Tooltips are a very useful feature in Power BI to extend the insights generated by a visual in a report. However, in the same way they can increase user’s…
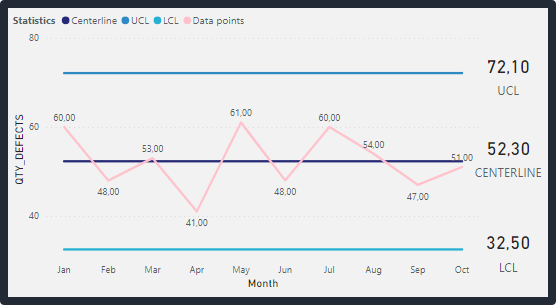
What is a Control Chart? A Control Chart is a statistical tool used in the field of process improvement, specifically in Lean Six Sigma methodology. It is used to monitor…

Introduction Why we would like to create Calculation Groups within our Data Model? Let’s just imagine that we’ve got a model containing several different Fact Tables that are doing a…