In the current Data World, security is a hot trending topic in whenever place you go, in whichever event you attend and in every company working to leverage data to make more data-driven decisions. One of the main concerns is about who can see what, which type of data and from which department (Logistics, Finance, Manufacturing, Human Resources). This can be turned into a more complex scenario when we give employees some self-service BI Tools (like Power BI). In one hand, we will be empowering them to dig for insights and make/share their own reports, boosting data-driven decisions. On the other hand, we could potentially put at risk the lineage and break the security applied for any user at the source if this security is not handled properly. However, as Uncle Ben said once: “With great power, comes great responsibility”.
In this article, we will cover a few scenarios on how to implement security in a Power BI Dataset, giving the ability to developers create/restore security roles and guarantee that each report consumer can only see the data that they have access to.
First things first, there is only ONE SINGLE WAY to implement security in Power BI, which is through the application of the Row Level Security (RLS). This type of security will filter the data which a user has access based on the profile role assigned to him/her (it’s like putting a hidden filter on a page that will select specific data).
There are two types of RLS:
Static: role based on a static filter created for each possible different role.
Dynamic: role is dynamic (so, the filter too as well) and depends on user access level which can be dynamically managed in a table.
Both types were already covered in many articles all over the internet. However, unfortunately, those cases are very simple and do not correspond with the complexity faced in real life. Not only showing both methods, at the end of the article, I’ll also present a more realistic approach, which the same “dynamic” role being associated with many different users.
Static Row Level Security (RLS)
We could approximate the Static Row Level Security with a filter that is pre-applied to a report when the user enters it. The idea of this is to create a filter rule over a column of a dimension table in the report and associate a role to this rule. Then, on Power BI Service, we can setup users under each role, making the pre-filtering to happen.
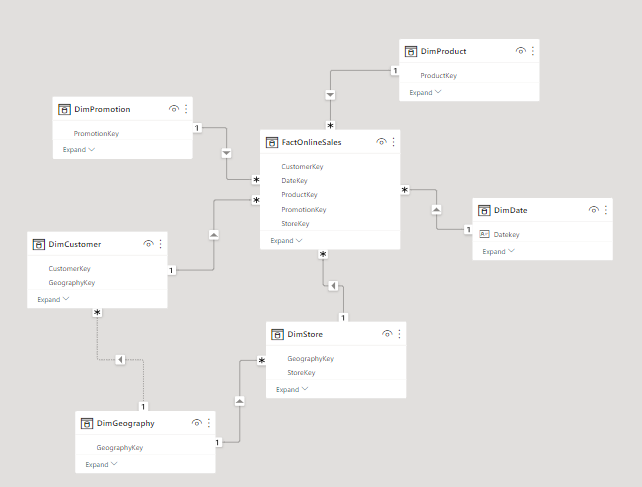
Enough talking, let’s build our Static RLS. For this, we’re going to use our old friend: the Contoso Data Model:
Fig 1: Contoso Data Model. Font: created by the author.
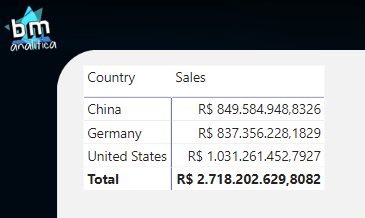
Now, let’s build a simple matrix containing Sales by Country:
Fig 2: Matrix containing sales by country. Font: created by the author.
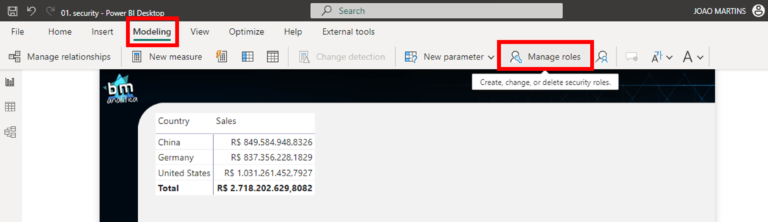
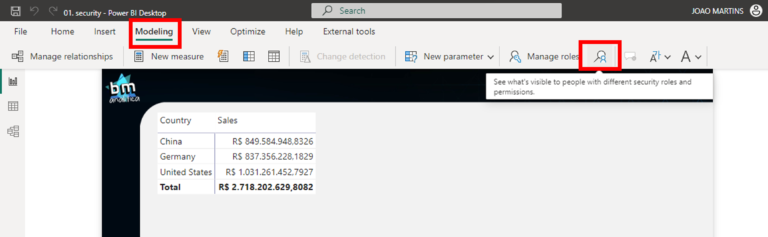
As I said before, the Static RLS is like a pre-defined filter that will be applied when the user with a particular role accesses the report. For this, we need to create those roles. To do that, let’s go to the Modeling Tab at the Top Ribbon and select Manage Roles:
Fig 3: Manage roles setup. Font: created by the author.
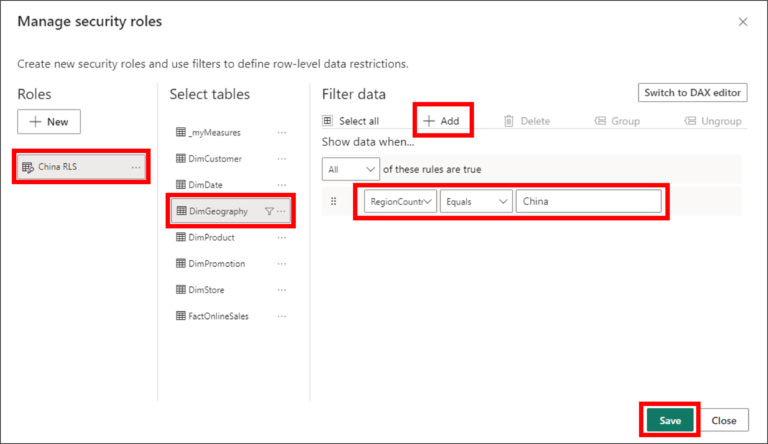
Once we click on it, a wizard will open for us. On Roles section, let’s create a role that will filter only the China country. To do this, we can click in “New” and rename it to “China RLS”. Then, we can click on the “DimGeography” table and finally on “Add”. This will create a rule to be setup. On the first dropdown, let’s select the “RegionCountryName” column, the second dropdown we can keep as it is and on the ComboBox we can put the string “China”. To finish, hit the save button to create the role and close the editor.
Fig 4: Setting up static RLS. Font: created by the author.
Once the role is created, we can test it! To do that, let’s go again to the Modeling Tab, but now let’s select the “View As” option:
Fig 5: Test Static RLS. Font: created by the author.
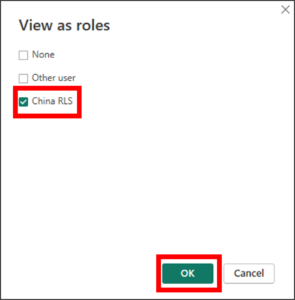
A new pop-up will appear, containing the Roles created on the dataset. Let’s select the “China RLS” and hit OK:
Fig 6: Select Role to test. Font: Created by the Author.
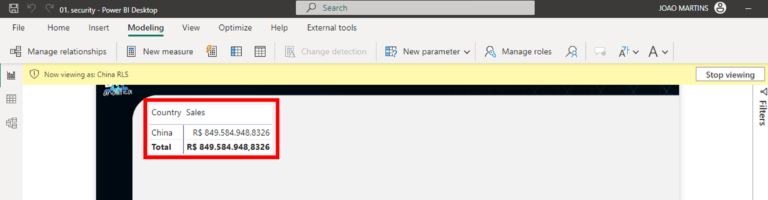
As we can see, a banner will appear saying that a RLS Role is being applied to the data, thus filtering the matrix only to China Country!
Fig 7: Test Static RLS result. Font: created by the author.
However, creating the roles in Power BI Desktop isn’t enough! We need to do some parametrization on Power BI Service after publishing. So, let’s publish the report and move to Power BI Service.
Setup Static RLS on Power BI Service
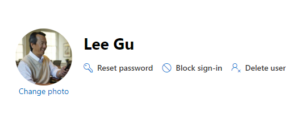
Once in the service, let’s share our report with the new China Sales Manager: Lee Gu. We’re going to use him to present all the different aspects of the RLS on the Service.
Fig 8: Lee Gu's profile. Font: created by the author.
The first consideration is (and for me, the most important!): RLS is only applied to users who are workspace viewers or with whom the report was shared to. This means, if a user has access directly to the workspace in a level higher than Viewer (Contributor, Member or Admin), the RLS WILL NOT BE APPLIED TO HIM/HER.
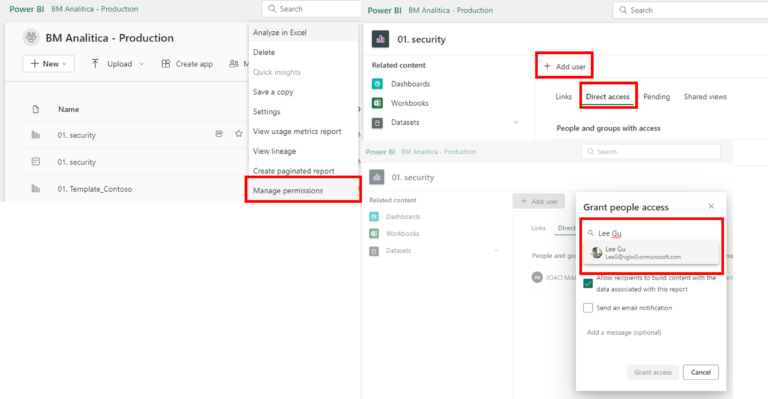
The second consideration is: you must setup the security on the dataset. Only sharing the report or dataset with a user doesn’t mean he/she will have the security automatically applied. Worst: if you don’t setup this, an error will appear and the user will not be able to access the report. To demonstrate this, let’s first share the report with Lee Gu. To do this, we can go in Power BI Service, find the report on the Workspace, click on the ellipses and then go to “Manage Access”. Once in this configuration page, we can go in “Direct Access” and then on the left upper corner select “Add User”. Finally, we can look for Lee Gu and Grant Access.
Fig 9: Sharing the report with user. Font: created by the author.
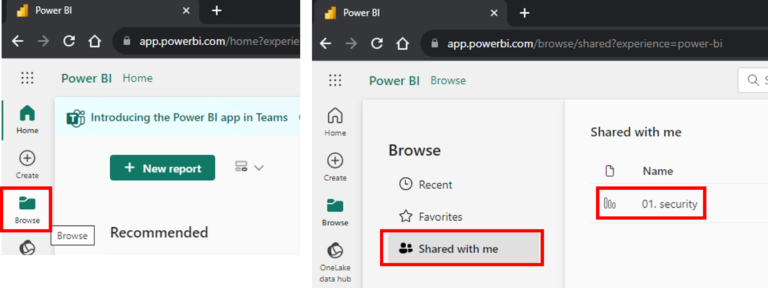
After receiving the access, we can log in Lee Gu’s account. To find the shared report, we can go on the “Browse” option on the left pane and then we can select “Shared with me”.
Fig 10: Accessing shared report. Font: created by the author.
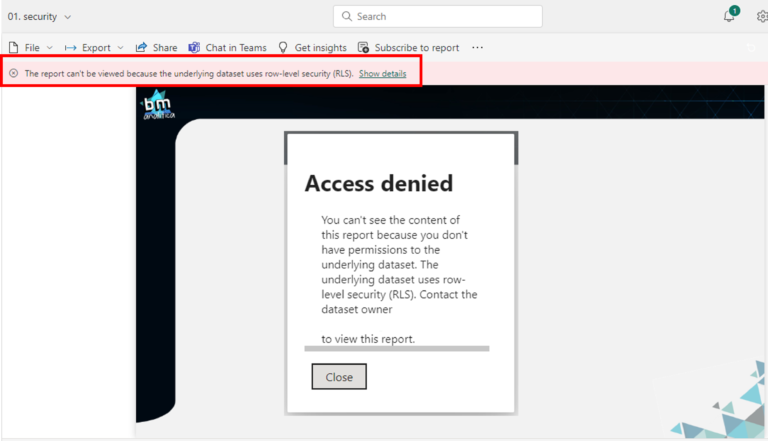
As we can see, the shared report is on the list and we can click on it to navigate to the report. Once that’s done and the report starts to load, as we can see, an error is thrown:
Fig 11: Access error. Font: created by the author.
When clicking on the “Show Details” we get the above pop-up message. The error mention that’s the underlying dataset has RLS applied to it which the user doesn’t have access. This error only happened because we have shared the report with the user but we haven’t set security.
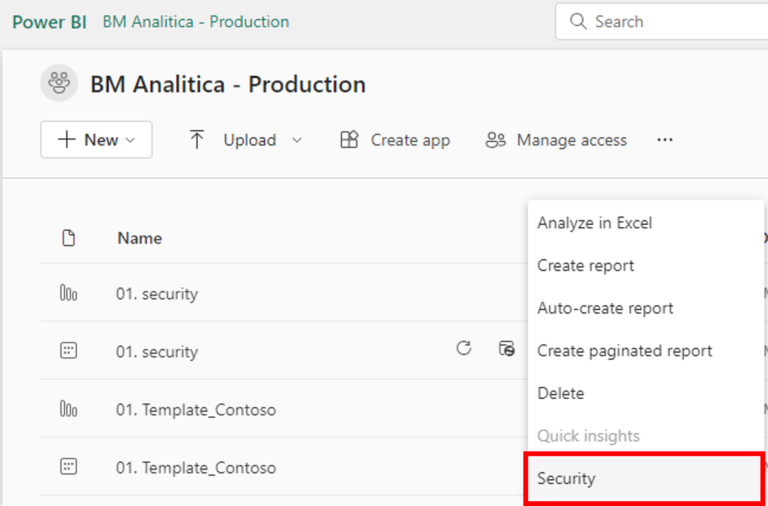
Going back to the report owner’s profile, we can navigate to the Report’s Workspace. On the list of assets, we can click on the ellipses to open the dataset settings and select “Security”:
Fig 12: Apply security on the dataset. Font: created by the author.
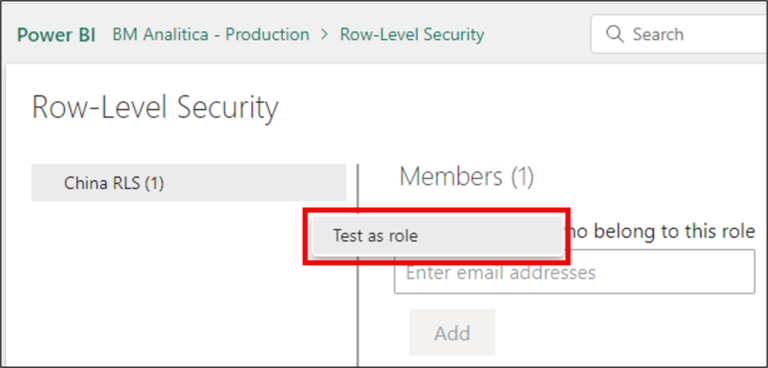
Once in the Security Settings page, we can identify that the report has a security role (“China RLS”). To check if this security role has the expected behavior, we can click on the ellipses and then “Test as role”:
Fig 13: Check role on Power BI Service. Font: created by the author.
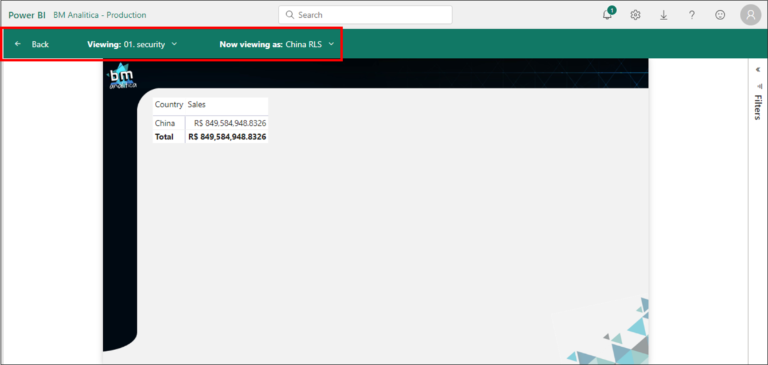
Then, Power BI will open the report under this role, which we can attest is working as expected:
Fig 14: Result of the test on the Service. Font: created by the author.
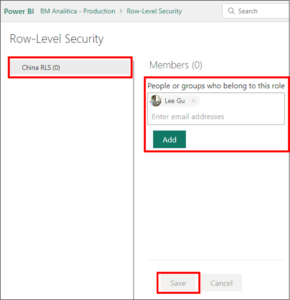
Going back to the security setup page, we can go back to the “China RLS” role. By clicking over this role, we can look for Lee Gu on the box and associate it to him. To finish, we just need to click Add and Save.
Fig 15: Setting the role to Lee Gu on the Power BI Service. Font: created by the author.
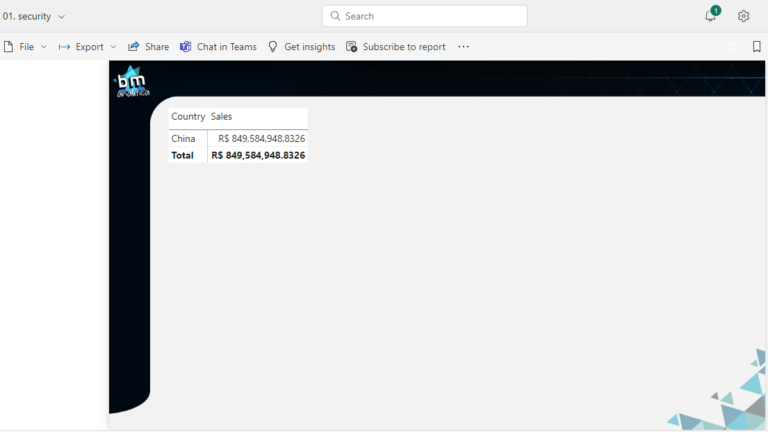
Going back to Lee Gu’s profile, we can refresh the report page. As we can see in the figure below, the data is showing on the report. Notice that it’s only showing the China country once Lee Gu was associated to this security role.
Fig 16: Lee Gu access to the report. Font: created by the author.
And that’s it! For more users or more profiles, remember not only to share the report with users but also make the right association on the Security Settings between users and roles.
Static RLS for All Countries
The main idea of the RLS is to restrict user access to all the data in the report. However, there’s always those positions in any Company which needs to see all the data available (a C-Level employee, for example).
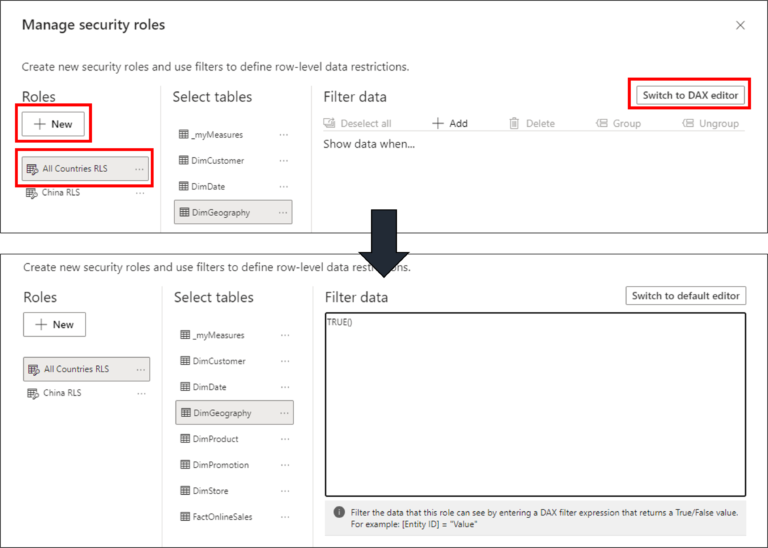
As we said before, we must enforce a security role for any user to allow him/her to see the underlying dataset. Thus, we need to create a role which has access to all the data on the report. To do that, let’s go back to the “Manage Roles” tab on our dataset in Power BI Desktop. Then, we can create a new role described as “All Countries RLS”. This time, we’re not going to use the Wizard to build the RLS rule. So, we can click on “Switch to DAX Editor” at the right corner. Once there, we can just insert TRUE() on the code block that appeared and then save it.
Fig 17: Setup All Countries role. Font: created by the author.
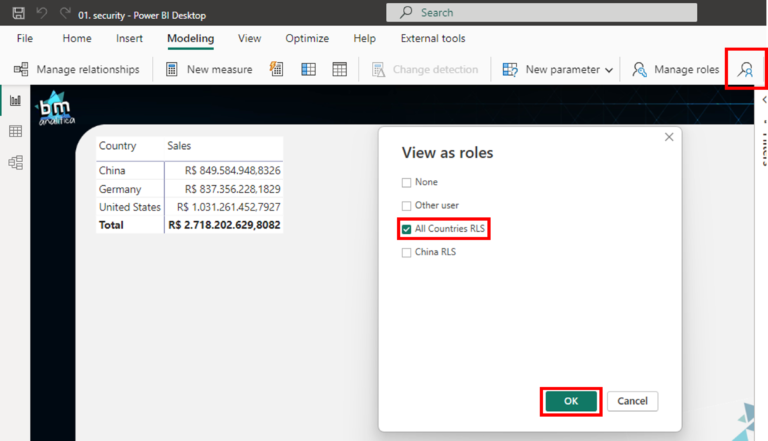
Now, let’s test the role in the Powe BI Desktop to check if everything is working as expected.
Fig 18: Selecting the role to be tested. Font: created by the author.
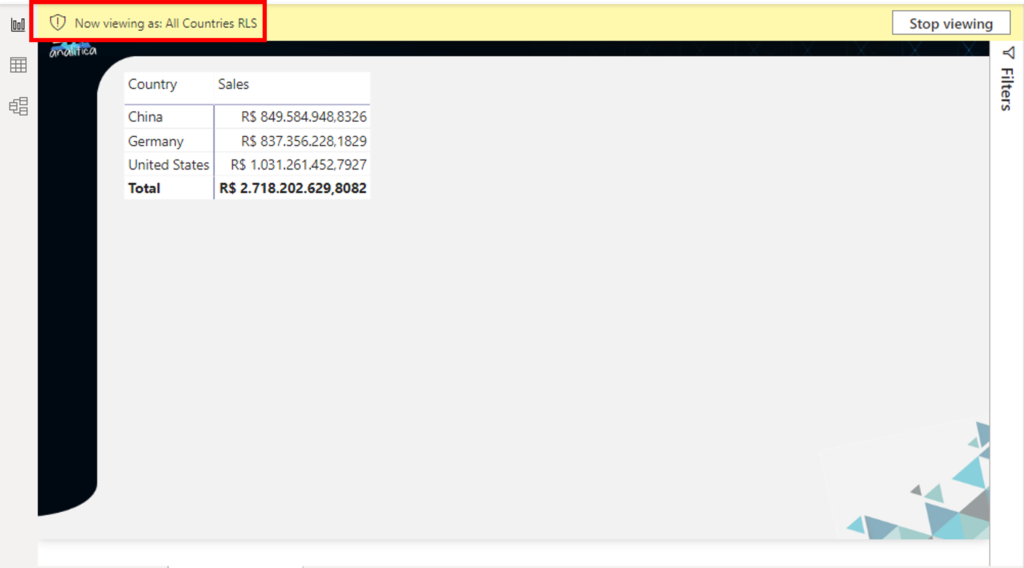
As we can see, the RLS role is applied and we can see the data from all the countries:
Fig 19: Result of All Countries role in Power BI Desktop. Font: created by the author.
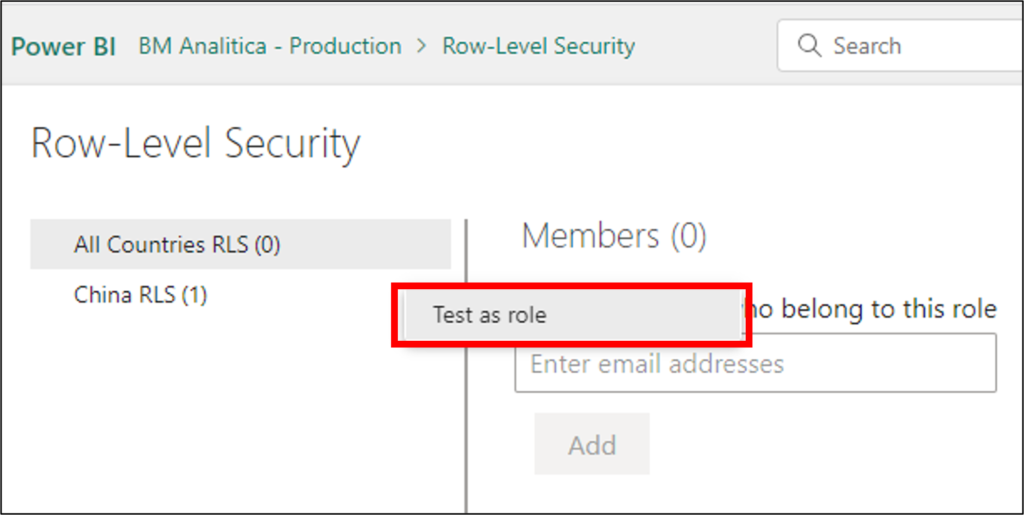
To finish this section, let’s Publish the report to our Workspace to test the role directly in the Web. Once there, we can just click on the ellipses over the role name and click on “Test as Role”:
Fig 20: Test All Countries role in Power BI Service. Font: created by the author.
Once there, we can check the result below, which contains all the countries in our model:
Fig 21: Result of the All Countries role test. Font: crated by the author.
Dynamic Row Level Security (RLS)
Okay, now that we defined the Static RLS, you may be thinking that granting access for each user for each role could be VERY difficult and time consuming, especially in large organizations. To deal with this scenario, we can apply what is called Dynamic RLS.
The Dynamic RLS is based on automatically setting security role for users. The main idea is to have a table connected in the dataset which will apply filters depending on the user who is connected to the report. By doing this, it’s much easier to bulk load a table with users or even build an automatic access request process that after approval will drop the user ID and his access on this security table.
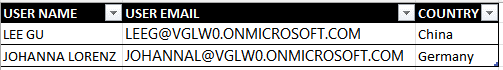
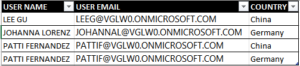
First, let’s create our table. It will have the following columns: USER NAME, USER EMAIL, COUNTRY. And why country? Because it’s the security key that we will use in our example. On any real situation, usually, this is a composite key made not only by country but also combining business, product family, product SKU, etc. For this example, we will also use another Sales Manager in our Contoso Organization: Johanna Lorez, responsible for Germany. Below, we can see an example of the Security Table:
Fig 22: Security Table. Font: created by the author.
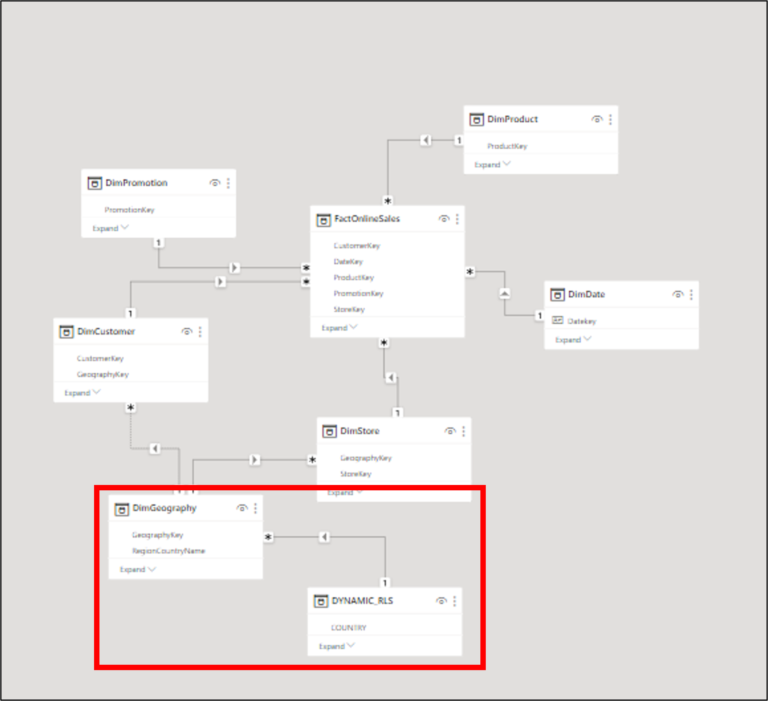
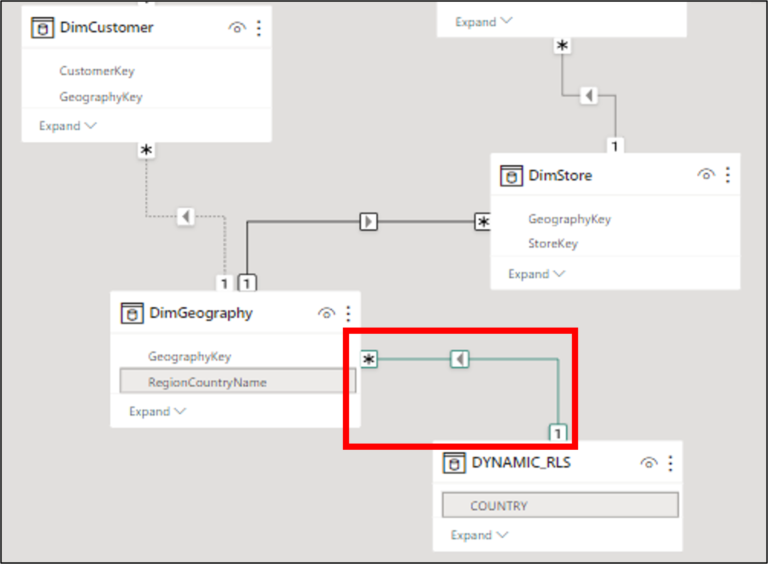
Let’s import the table into our model and connect the RLS table with the DimGeography. This will allow the filter to propagate through the relationship from the RLS Table to the Country Table. Taking advantage of this, we can use a set of special functions like USERNAME() or USERPRINCIPALNAME() to extract the user who is logged in the Power BI Service to apply the filters over the data.
Fig 23: RLS Table connected in the model. Font: created by the author.
Once the relationship between tables is setup, we can go into Manage Roles to create a new one. On this, we can add a New Role over the DYNAMIC_RLS table. For making this dynamic, we need to switch to the DAX Editor and then add the following formula:
[USER EMAIL] = UPPER(USERPRINCIPALNAME())
The USERPRINCIPALNAME() function, once published to the service, will return the email of the user logged in. To avoid any confusion with the uppercase’s comparison, we also applied the UPPER() formula, to make it entire in capital letters (notice that on fig 22, in the security table, we setup all in uppercases as well). Then, having this email on the Security Table will filter it to the keys the user has access and will propagate it to the dimension, making available to the user only the data he/she has access to.
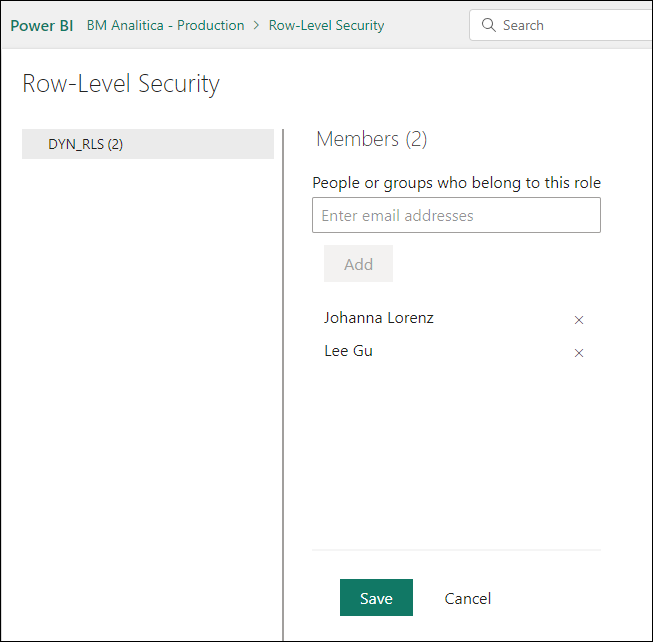
Let’s publish it and then setup the security on the dataset in Power BI Service for both our users: Lee and Johana.
Fig 25: Setup dynamic RLS on Power BI Service. Font: created by the author.
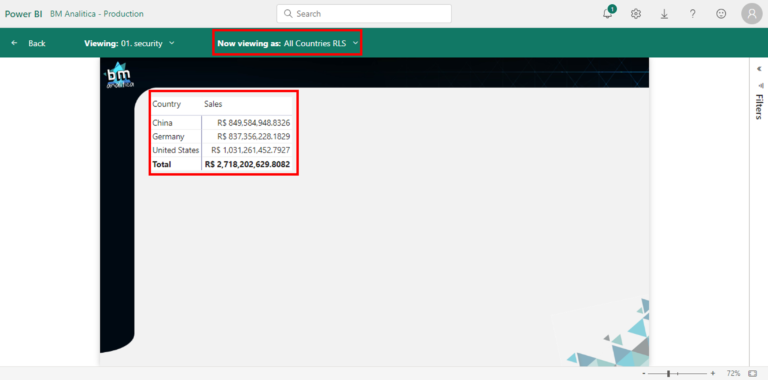
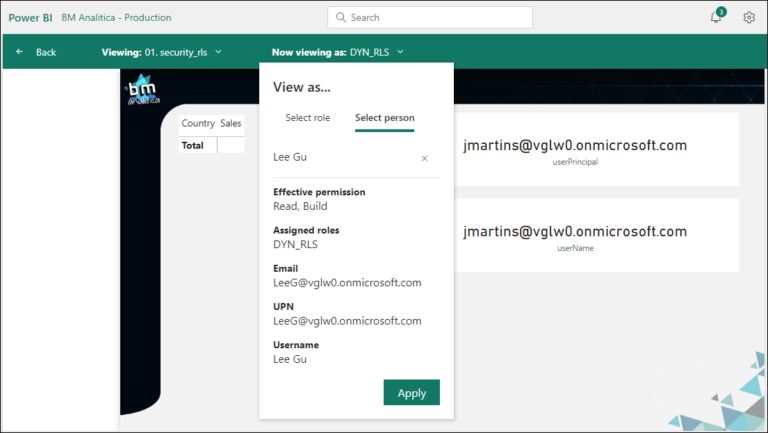
Once saved, we can click on the ellipses and select “Test as Role” again. Now, under the “Now viewing as”, we can click on “Select person” and then pick Johanna or Lee to test if the security is setup properly (just remember to share the report/dataset with them before):
Fig 26: Dynamic RLS test. Font: created by the author.
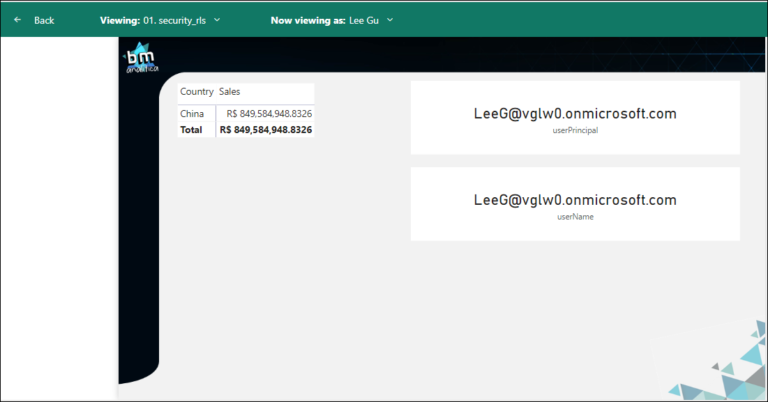
In this example, we looked for Lee Gu’s profile. Below we can see the result:
Fig 27: Lee Gu's dynamic access test. Font: created by the author.
As expected, when Lee Gu logs in the Report, he will only be able to see the data from China, once that, automatically, the Power BI Service will pick the user email and then will apply the filter on the DYNAMIC_RLS table. The filter on this table will be propagated to the Geography Dimension table that will filter only the rows on the Fact Sales table that are corresponding to China.
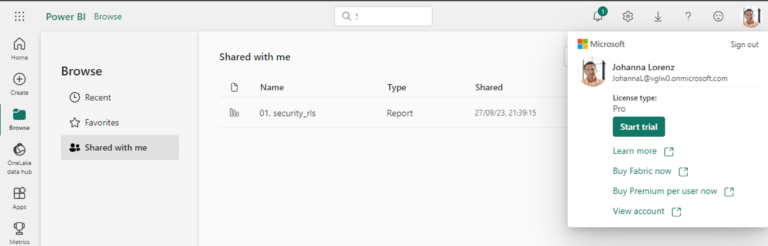
Let’s log into the Power BI Service using Johanna user now. Once logged into his account, we can go into the “Browse” option on the left navigation panel and later on the “Shared with Me” option.
Fig 28: Johanna's access on the Service. Font: created by the author.
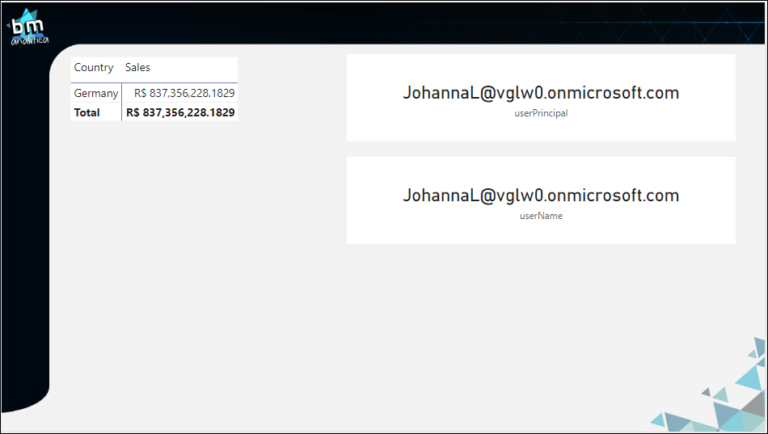
There we will find the report, which we can click to navigate to:
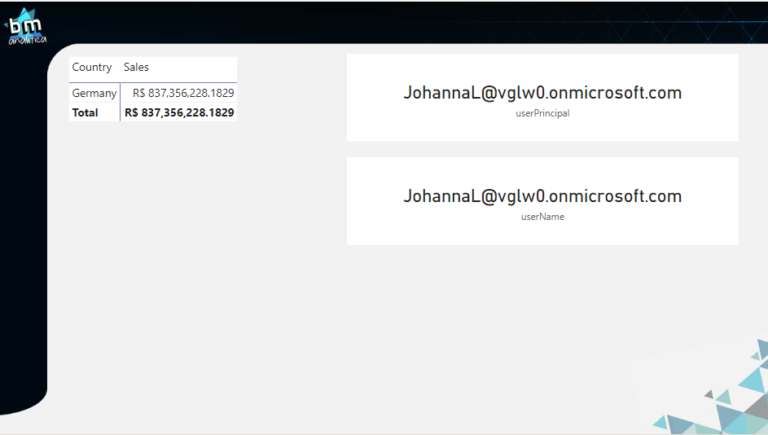
Fig 29: Test result for Johanna. Font: created by the author.
As we can see, the entire report is only filtered to Germany, which is security role associated to Johanna.
This is how the Dynamic Row Level Security works. Now, we don’t need to manually setup roles to people anymore. We do not also have to create different roles to filter a specific Country. We can just have the user’s email dumped in a table associated with the security keys (country in our case). It’s a much more straightforward and easier way to setup security, especially when you associate this with an automated approval process for security roles. The only drawback now is that you also need to share the report with users and setup their Security on the dataset (but again, you’ll have only to setup this once and not for each role created). However, this can be solved using security groups and integrating on the approval pipeline (in future, we will have an article only about sharing report/dataset with users).
Even though this being a very good approach, if you are already imagining future applications, you’ll stand in front of a very particular use case: what if more than one person has to have access to the same country? This is what we will dig into in the next section.
Dynamic Row Level Security (RLS) with Bridge Table
Our last and ultimate use case is when we want to apply Dynamic RLS when different users should have access to the same security key. This is a very common scenario, much more common than just applying Dynamic RLS. The most common example is: you are China Country Manager, thus you should only have access to that specific country. However, your boss is the Region Manager, thus he needs to have access to China plus all the other countries in the Asia Region.
Going into our model, we can see that the DYNAMIC_RLS table has a One-to-Many relationship with the DimGeography table. Which means, on the DYNAMIC_RLS side, we’re expecting to have just one Country per row, which then means that only one person can be associated with each Country (the security key in our example) that will finally means that if we add Lee Gu’s boss with China Country security key, we will end up having a Many-to-Many relationship.
Fig 30: Relationship between Dynamic RLS table and Geography table. Font: created by the author.
A Many-to-Many relationship is not an optimal solution, especially if the security table is a very large one, which can cause some performance issues (see this article which I talk more about Modelling Best Practices).
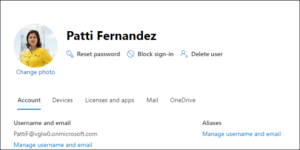
On the same article, there’s also a solution on how to deal with Many-to-Many relationship by using a bridge table. This is exactly what we’re going to build next. To begin with, let’s introduce you to Patti Fernandez, Lee and Johanna’s Manager:
Fig 31: Patti Fernandez's profile Font: created by the author.
Let’s also setup Patti’s access on the Security Table:
Fig 32: Setup Patti's access on the Security Table. Font: created by the author.
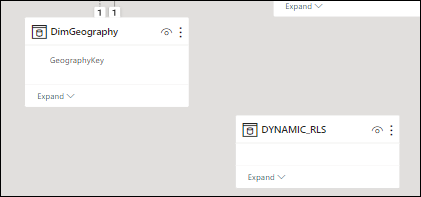
Before refreshing and loading the table in the model, we have to break the existing relationship to fit between both tables our bridge table.
Fig 33: Break relationship between tables. Font: created by the author.
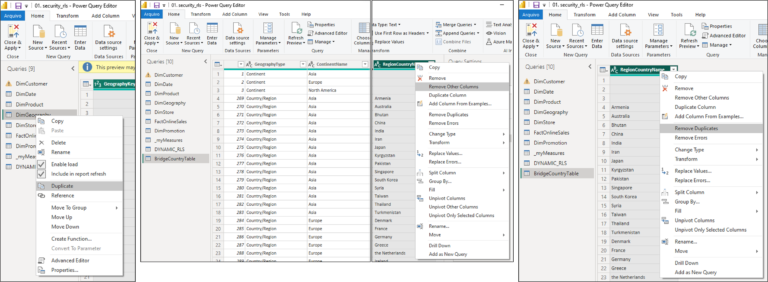
Once this is done, we can go into the Transform Data in order to build the bridge table. The easier way to do that is to duplicate our DimGeography table, keep only the Country column and then remove duplicates from it.
Fig 34: Setup bridge table in Power Query. Font: created by the author.
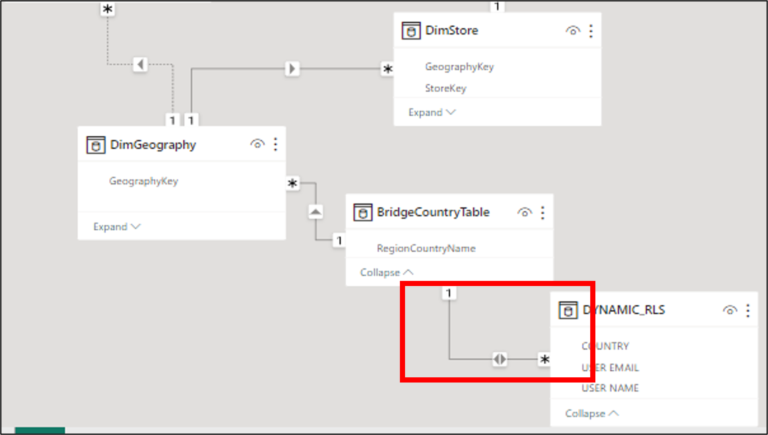
Once this is done, with the Bridge table loaded in our model, we can setup again the relationships. As any bridge table, we will have to make a Bidirectional Many-to-One relationship from the DYNAMIC_RLS table to the bridge and then a Single-Directional One-To-Many relationship from the bridge to the DimGeography.
Fig 35: Bridge table setup in the data model. Font: created by the author.
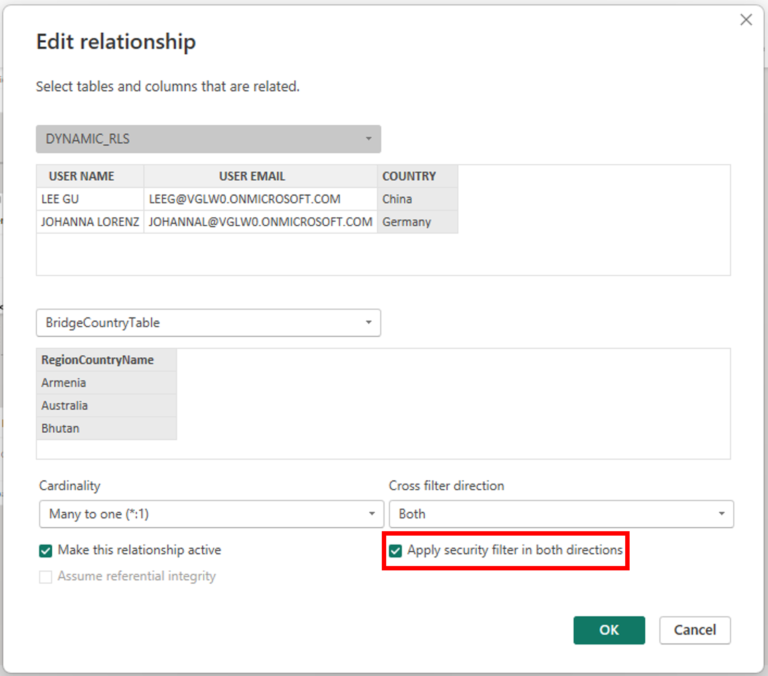
A very important point when setting up the Bidirectional relationship from the RLS Table to the Bridge is to check the configuration to “Apply security filter in both directions”. Without this, the bridge table will not work and users will be able to see everything (like, without security).
Fig 36: Relationship configuration. Font: created by the author.
Now that the setup is done, let’s Publish it to make some tests. First, let’s go again into Johanna’s account to certify that nothing has changed on his access:
Fig 37: Johanna test on Service with Bridge Table. Font: created by the author.
As we can see, the security is working as before. Now, let’s connect into Patti’s account. Following the same process to find the shared report, we can access it:
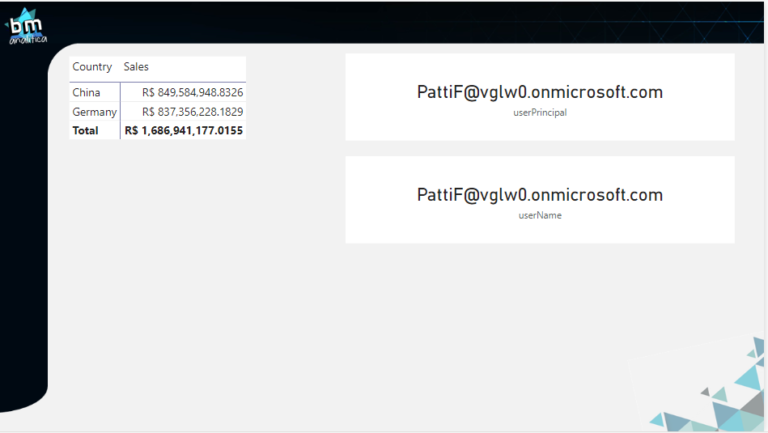
Fig 38: Security test with Patti Fernandez's profile. Font: created by the author.
As we can see, Patti has access to both countries: China and Germany, as expected.
Conclusion
Well well well, that’s all for today folks!
On today’s article,
we covered a lot about how to apply security in our data model restricting the
access to the data only to the users with the proper role set.
I really hope this helps you to implement security in our data models, especially with the two special cases: All Countries and Bridge Table.
Cheers,
Have this article helped you and wanna appreciate it? Check below how to do that!