A few months ago, an excellent youtuber name Bas Dohmen – founder of datatraining.io published an excellent video on youtube demonstrating a technique which can automatically select measures based on the user who is logged in Power BI. On the video, Bas uses a technique using Field Parameters, DAX measures and special tables to switch between measures to get the desired result.
By chance, this video was released at the same time that I was writing the article about Security in Power BI (more details here).
At that time, I’ve just thought about instead of using DAX measures, why not use the already built-in RLS functionality of Power BI combined with the Field Parameters?
That’s what we’re going to cover in this article today! Stay tuned and let’s dive in it.
Basic Setup
First things first, let’s build two simple measures in our already known Contoso Data Model. The first measure will be the Sales Amount and the second will be Sales Quantity.
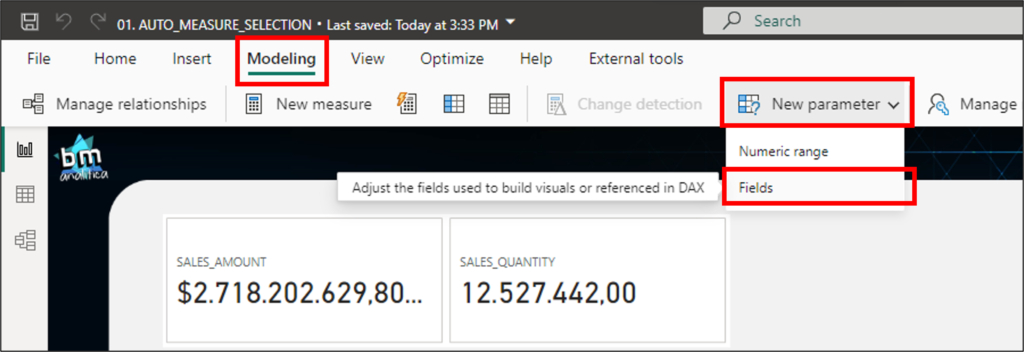
After this, we can create the Field Parameter containing both measures. To do this, we can go on the Modelling tab, select New Parameter and then Fields.
Fig 1: Field Parameter setup. Font: created by the Author.
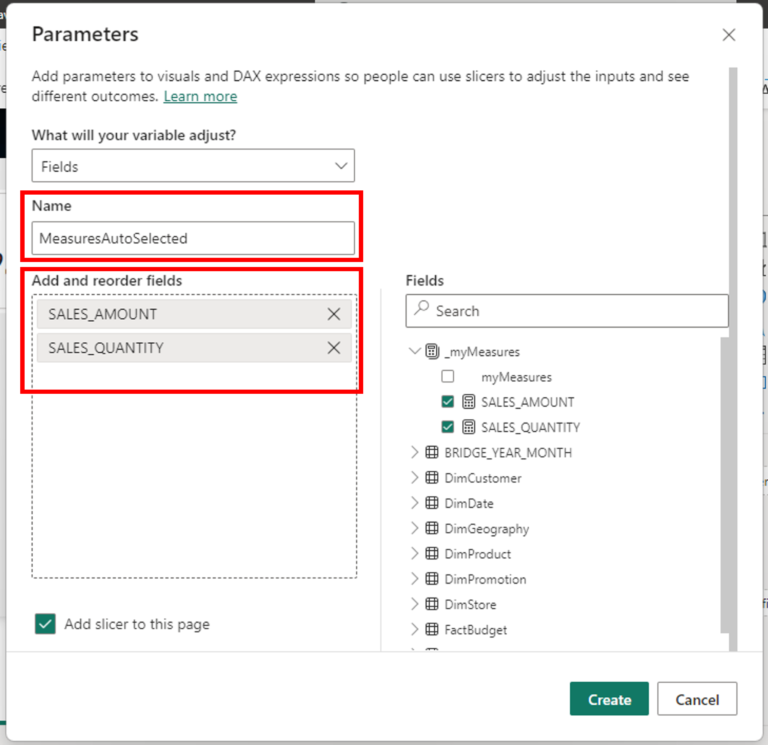
Once the wizard opens, we can give a name to the Field Parameter, there we can select both measures we’ve just created.
Fig 2: Field Parameter measure selection.
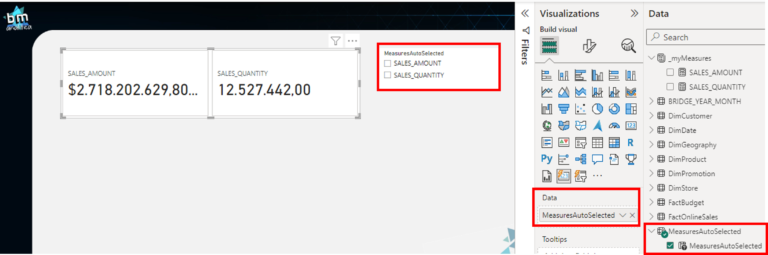
We can put the parameter column on a Card and also applying a slicer on the page with the same parameter column.
Fig 3: Field Parameter testing on a page.
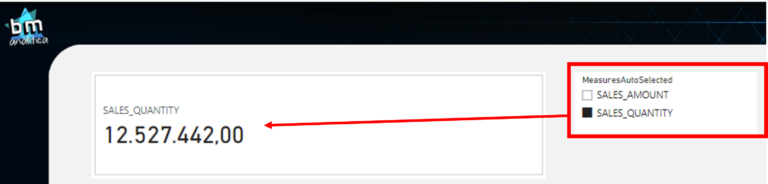
By doing that, we can toggle between the measures on the card.
Fig 4: Field parameter changes
RLS Key on Field Parameters
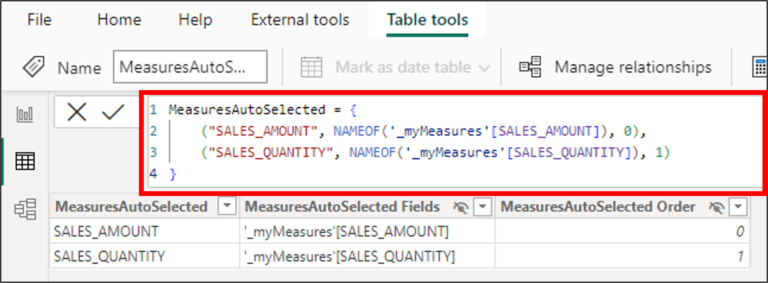
Now that we have already setup our field parameter, we need to include somehow a key to be used as filter by our RLS. Looking on the Field Parameter table created, we can notice that it’s a Calculated Table.
Fig 5: Field Parameter construction.
Notice that this table in created using a table construct, using the brackets, as the following below:
Table = { ( Column 1, Column 2, etc. ) }
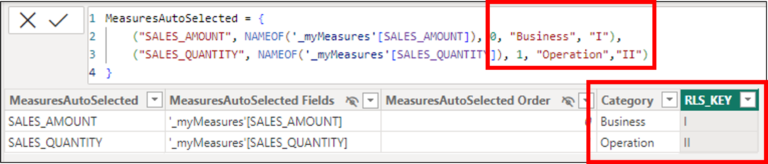
This means that we can extend the columns present in this table. Let’s create two more columns: one for measure category and another to be used as key:
Fig 6: Extending columns on the Field Parameter table.
After creating the columns, we have also renamed them to a more appropriate definition.
RLS Measure Table & RLS Rule
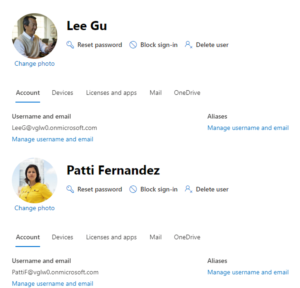
With the field parameter already setup, we can define our RLS Table. But first, let’s introduce two different users: Lee Gu, our marketing manager interested only in Sales Amount, and Patti Fernandez, our manufacturing manager, interested only in Sales Quantity.
Fig 7: Lee Gu & Patti Fernandez user profiles.
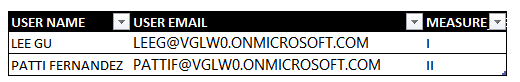
Based on the interests of each user, we define for each one what measure’s key they would like to have. From the previous section, we saw that the measure SALES_AMOUNT has the key number “I” and SALES_QUANTITY has the key number “II”. With that in mind, we can create the following table to be user as security:
Fig 8: Secuirty Table based on user login (Dynamic RLS).
We can now include this table on the model. For this article, we are going to include it directly copying and pasting in the model. This will be a fixed table, but for sure you can decide the best way of having this table on your model that will allow it to be refreshed (SQL Table, Excel in Sharepoint, Sharepoint List, etc).
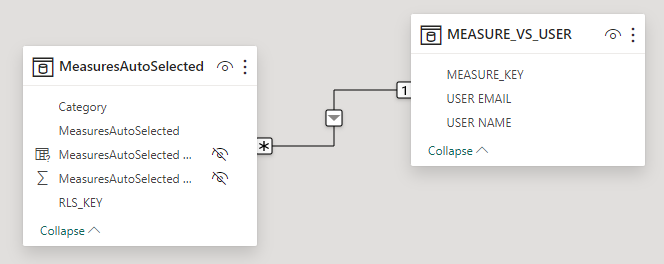
In our model, we have the name for this table as “MEASURE_VS_USER”. Once loaded, we can connect this table with the field parameter table by the Keys column, as following:
Fig 9: Security table connected on the model.
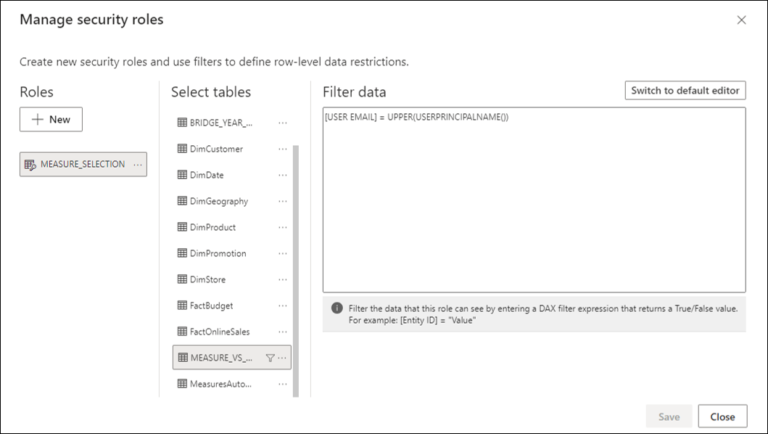
With our relationship in place, we can define our RLS Rule, which will be applied based on the user who is logged in the Power BI Service (more about this in this article about security in Power BI). To do this, we can go on the Modelling Tab and select the “Manage Roles” option. On the user, we can create a new role named “MEASURE_SELECTION” for the MEASURE_VS_USER table. Once on the table, we can switch for the DAX Editor and include the following DAX Code:
[USER EMAIL] = UPPER(USERPRINCIPALNAME())
The security will be as following:
Fig 10: Security rule applied.
Testing the Automatic Selection
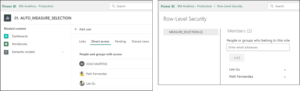
Let’s published our report to the service to test if the automatic measure selection is working for each of our users. Just remember that, prior to go directly to testing, we need to guarantee access and security setup for each user on the Power BI Service.
Fig 11: Security setup on Power BI Service.
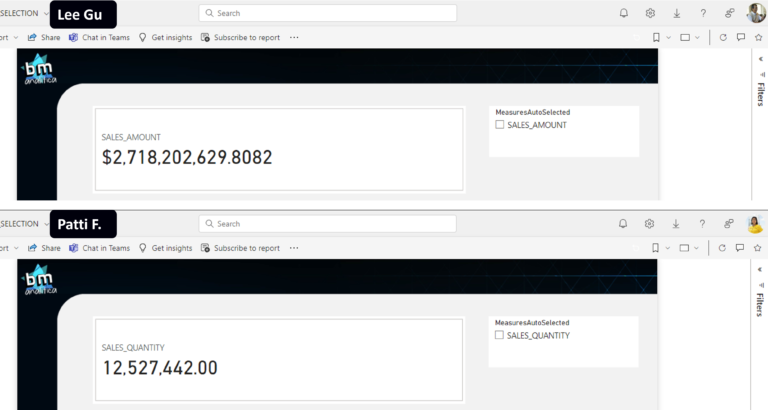
Once the users have their permissions set, we can log in with each one of them. The result can be seen below:
Fig 12: Result on Power BI Service for each user.
As we can see, the RLS was successfully applied, and each user can only see the measures selected for them.
Create slicer between my measures and all measures
Well, as we can see, the previous test had the expected result. However, what if the user wants not only to see his/her measures but also the others? What if our scenario is: show my measures by default but let me navigate through other if I want?
In order to improve our model, we can create a slicer that will allow the users to select only their measures or all the measures from the report. To do this, I will confess here, we will have to do some sort of a “hack”.
By checking figure 9, we can see that RLS is a filter propagating through a relationship. But we cannot simply “break” the RLS using DAX, once the security is applied beforehand any other type of DAX calculation. This prevent us to play with the model relationship using DAX (more about this on this SQLBI article).
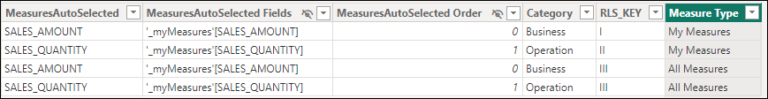
Thus, we will have to play with the data model to accomplish what we want to do. Even not being the most perfect and optimal, one idea is to duplicate the measures on the Field Parameter table and include another key, but, this time, will be the same key for every measure. We’ll also add a new column, to separate what is “All Measures” from “My Measures”.
Fig 13: Adjustments on the Field Parameters table.
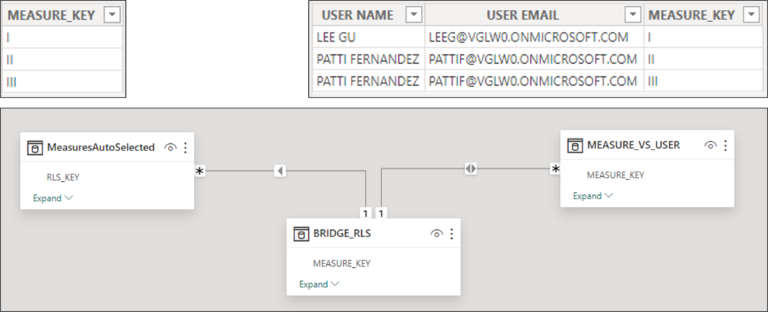
We also need to change the security table “MEASURE_VS_USER” and include a bridge table in between this table and the Field Parameter table. In our example, only Patti Fernandez with have the ability to see all measures, however we need to include the bridge the accommodate any future user with the same behavior as Patti. Once everything is loaded, we can reconnect our model as below:
Fig 14: Adjustments on the data model.
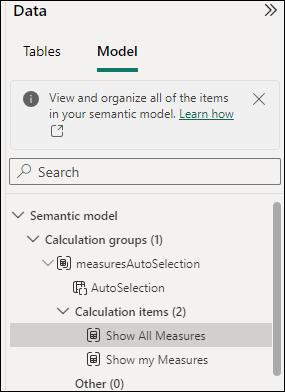
To make the slicer react, we need to create a calculation group to wrap the filter for the RLS_KEY number “I” or “II”, which means the user’s measures, or the RLS_KEY number “III”, which means all measures. We can include the DAX code into calculations items. By creating the calculation group, we are able to use it on slicers, creating the desired user experience.
If you want to know more about how to create calculation groups, you can see our previous blog post or follow this one from Microsoft Docs. On our approach, we used the brand new feature for authoring Calculation Groups directly on the model. Our final output is this one:
Fig 15: Calculation Group for Measure Selection.
Each calculation item has the following code:
Show All Measures = CALCULATE(SELECTEDMEASURE(),MEASURE_VS_USER[MEASURE_KEY]="III")
Show My Measures = CALCULATE(SELECTEDMEASURE(),MEASURE_VS_USER[MEASURE_KEY]<>"III")
Once we’re done with this, we can go back to the Report Canvas and add another slicer containing this Calculation Group. By default, we can let it selected to “Show My Measures”:
Fig 16: Slicer with Calculation Group on Canvas.
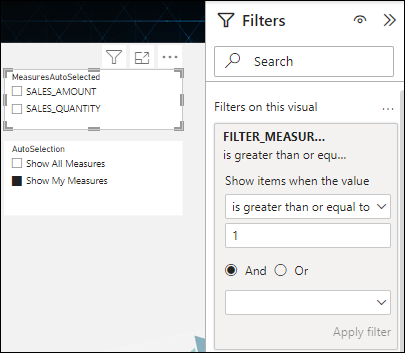
However, just doing this will not impact the way the slicer containing the measures names is shown, which means, this will not slice and dice just by selecting something on the Calculation Group slicer. To force that selection to happen, we need to apply a filter behind the scenes on this slicer. The filter will use a measure, that will then intercept what is selected on the slicer combined with the RLS and assign True/False for each option (“II” or “III”). By doing that, the slicer will respond to the new filter and show only the measures desired. First, we need to create the following measure to be used as a filter condition:
Once this measure is created, we can apply it behind the scenes on the Slicer containing the measure’s name. We will also include the new category column for measures created on the Measure’s slicer:
Fig 17: Setup for toggling between measures.
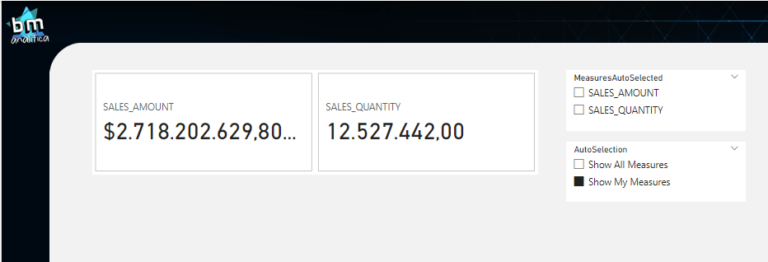
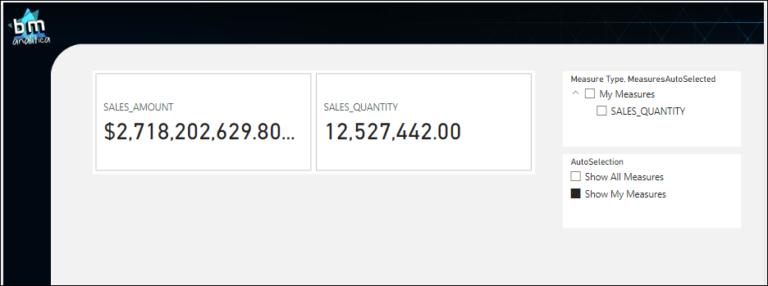
Now, we can published our report and test the result with Patti Fernandez login. The result is shown below:
Fig 18: Patti Fernandez result on Power BI Service.
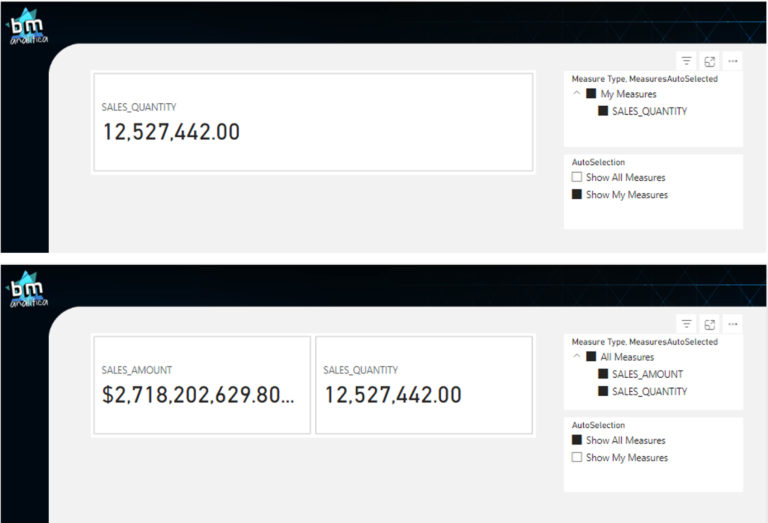
As we can see, even though we’re selecting “Show My Measures”, once the slicer, the one for measures, is “open” without any selection, all measures will be shown to Patti. This is the drawback of this solution (also the fact the user will always have to select measures on the slicer after changing the AutoSelection slicer). However, with the creation of the Measures category, we are able to give a better user experience for them to pick what they want on the slicer. Below, you can see the result for each selection:
Fig 19: Toggling between options on the slicer.
Conclusion
As we could see, based on Bas video, we were able to apply a similar approach using Row Level Security (RLS). To extend the content of this article, we also showed how we can show not only the measures selected for a particular user but all measures too. Bas does a similar way on his approach, but once he does everything based on DAX Tables and Measures, he was able to play with the table’s relationships. In the end, both approaches are very similar. However, if you have a super strict condition to only show certain measures for certain users, the RLS approach would be more suitable (combined with Object -Level-Security).
Well well well, that’s all folks! Hope you have enjoyed this article!
See you on the next one!
Cheers,
João Martins
Have this article helped you and wanna appreciate it? Check below how to do that!