In this blog post, we will cover a technique used to remove undesired records from a matrix visual in Power BI. In fact, not only on matrix visuals, but it can be extended to other different visuals too.
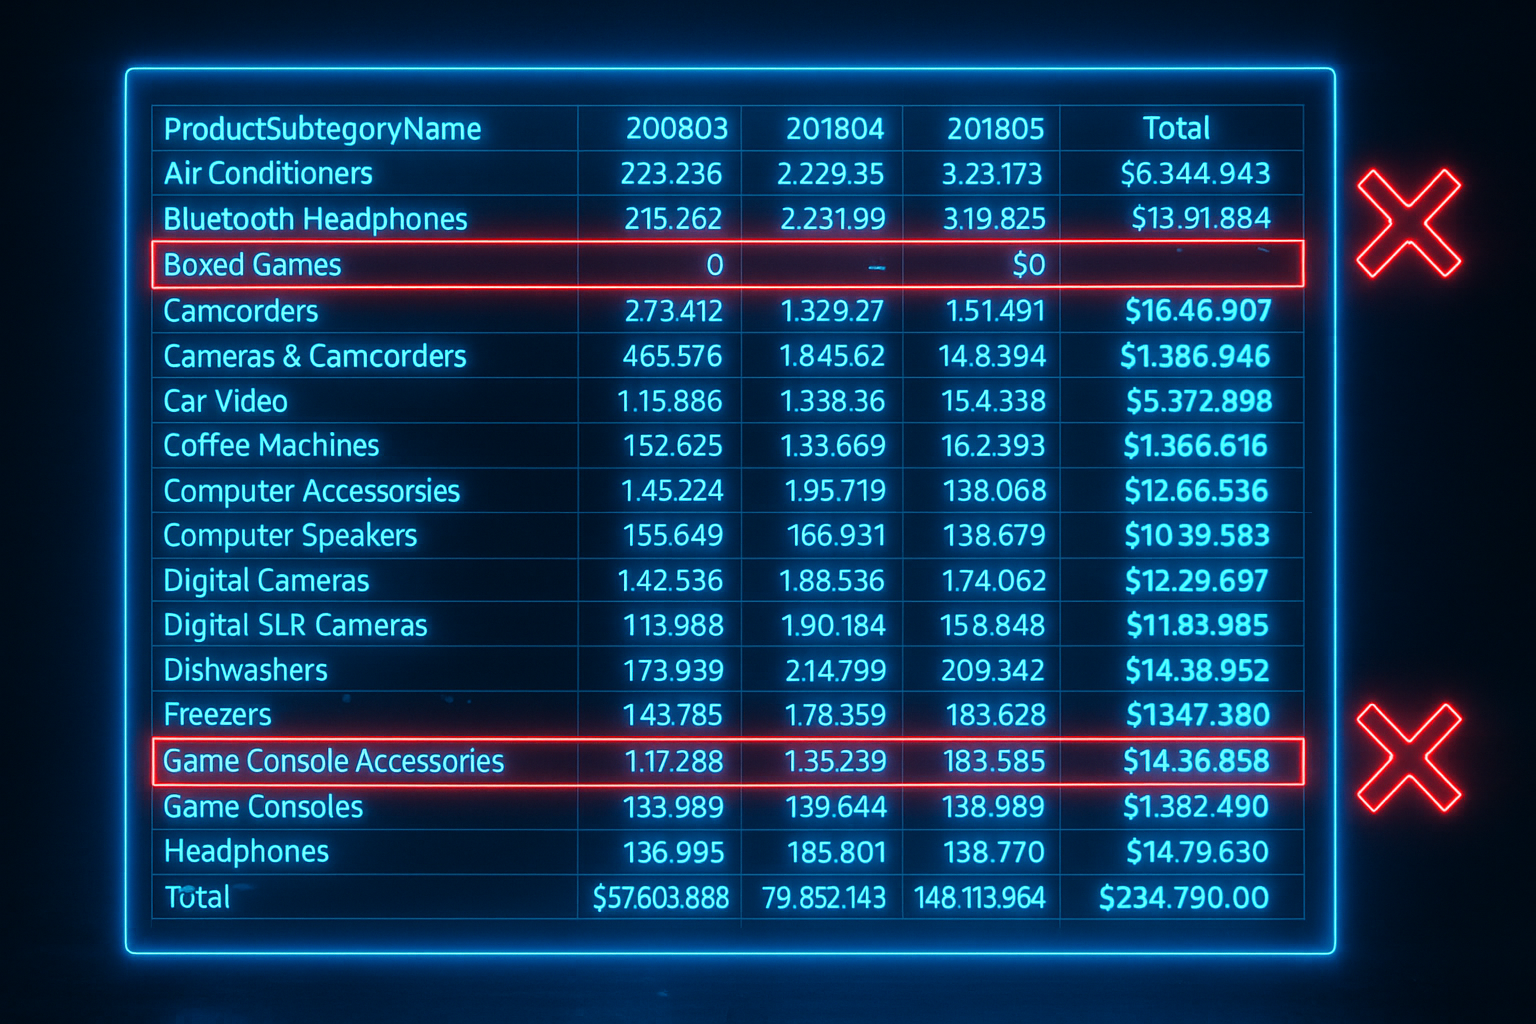
The main motivation behind this technique is to make a matrix visual look cleaner, removing any dimension records which results are zero and or blank. To illustrate, take a look on the image below, the idea is to create a technique which will remove the records marked in red.
Fig 01: Example of the business case.
Background and Business Case
Our data model is a very simple one. It has only one fact table containing already aggregated data for the brands (as a fact), a data and brand table as dimensions.
Fig 2: Data Model.
If you have understood well, our idea is to create a technique that will remove the rows from the matrix which has no data associated, if it’s blank or 0 value. If, in our scenario, all the columns (the months in our example) for a dimension have a “blank” after the measure evaluation, the Power BI VertiPaq engine would automatically remove this dimension from the result set. This is the usual behavior of the SUMMARIZECOLUMNS() function, which is basically applied in any DAX query generated by any Power BI visual (more details you may find here).
However, as you can see, for the dimensions “Boxed Games” and “Desktops”, in Figure 1, we have two months with blanks and another with $0 – and this $0 evaluation is not a “blank”, making these 2 subcategories to show up on the result. If we think from a Business perspective, we could also remove these two Subcategories from our matrix, once they’re “zeros” or “blanks” anyway. It doesn’t make much sense to show these there and, in fact, it only disturbs people when they are reading the matrix, causing a bad user experience.
With all that said, let’s jump in and start building our technique that will also remove these two subcategories from the evaluation.
Creating and applying the technique
The main idea behind the technique is to leverage the already mentioned behavior of SUMMARIZECOLUMNS() function. After evaluating the measures for a given combination of dimensions, SUMMARIZECOLUMNS() will only keep the dimension set which result is non-blank. This is how the function works by design.
As also already mentioned, the “$0” value is not a “blank” value, which means that we indeed had a sale with a “$0” amount. There are many reasons why something like this might happen.
Well, so what if we transform the “$0” value into a “blank” value? By doing this, the final evaluation of the SUMMARIZECOLUMNS() will return a “blank” for that particular subcategory, removing it from the result set. Furthermore, we want this technique to be flexible enough to be used in any measure we have on our model.
In order to make this technique flexible enough, we must consider the use of Calculation Groups (don’t know what they are? Take a look on this article). Let’s start launching Tabular Editor (yeah, even though we can create them directly on the Power BI Desktop, I still prefer to use Tabular Editor) and creating the calculation group and calculation item.
Fig 3: Creating a Calculation Group on Tabular Editor.
Now, the idea is to intercept the result of the measure and, if that result is equal to $0, return a blank instead of the result itself. This way, we will transform the $0 in blank and, combined with the other blanks already evaluated for the other months on the matrix, the engine will remove the two subcategories from the matrix. Below is the DAX code used on the Calculation Item:
Fig 4: Creating the calculation item.
var _meas = SELECTEDMEASURE()
var _result = IF(_meas = 0,BLANK(),_meas)
RETURN
    _result
Time to test our Calculation Item, let’s add it as a slicer on our canvas and check if it’s working as expected:
Fig 5: Calculation Group slicer added to the canvas.
Fig 6: Calculation Group applied and final result.
As we can see, after applying the calculation item, we can see that the two subcategories were removed from our matrix, making it cleaner and giving a better user experience.
Conclusion
As we can see, we defined a technique that we can use to remove non-useful records from a matrix visual, which we can also extend to other visuals. Furthermore, with this technique, we can also remove records or subcategories that are above/below certain boundaries or thresholds (you will only have to tweak a little bit the DAX within the Calculation Item).
By using this technique, we can have much cleaner results on a matrix, removing undesired and not useful results.
Well well well, that’s all for today folks! See you on the next,
Cheers
João Martins
Have this article helped you and wanna appreciate it? Check below how to do that!