In my opinion, Field Parameters was one of the best features Power BI has already released. It gives so much flexibility for developers build complex logics and complex interactions using filters and slicers which were almost impossible before – and let’s say, when possible, we had to tweak and play A LOT with calculation groups, building auxiliary tables and coming up with crazy DAX functions (which in most of the cases only who developed it was able to decipher what is going on behind the scenes).
Well, Field Parameter is still in preview up to the date when this article was written – and let’s be honest that I really don’t know why once it’s already being used broadly by the community. In this article I’m going to show to you one of my favorite patterns unlocked by this feature: the ability to swap, at the same time, measures and axis on a particular visual.
Field Parameters
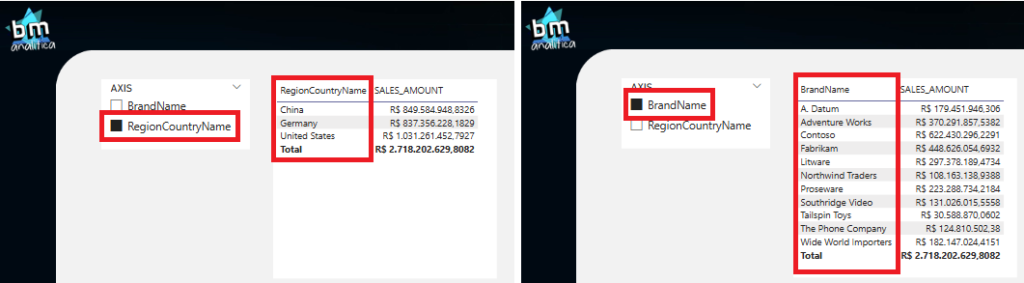
Field parameters were released by Microsoft in May 2022 (link). They are a great feature that allows us to pick columns from different tables and, when placing the parameters on a chart, we can swap which column is used as axis or aggregation by simply selecting them on a slicer:
Fig 1: Selecting column to be placed on matrix rows.
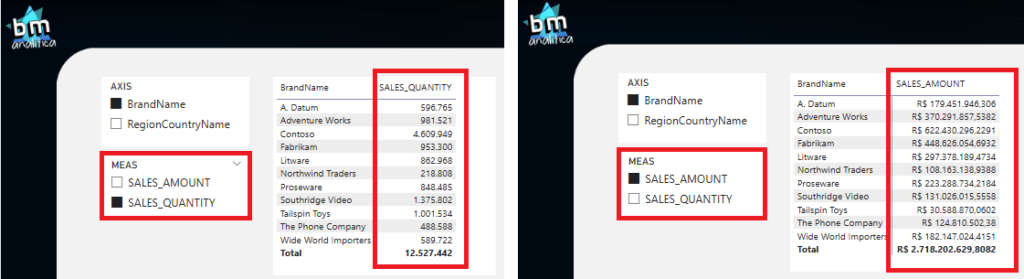
The same way, we can also do it with measures, making it very easy for users to place whatever measures they want to analyze in a particular visual:
Fig 2: Selecting measures to be placed as values on the matrix.
Extending Field Parameters Capabilities
Just the simple behavior of Field Parameters demonstrated in the previous section is already very powerful for developers crafting reports with great UX. However, we can extend the capabilities of this feature even further more.
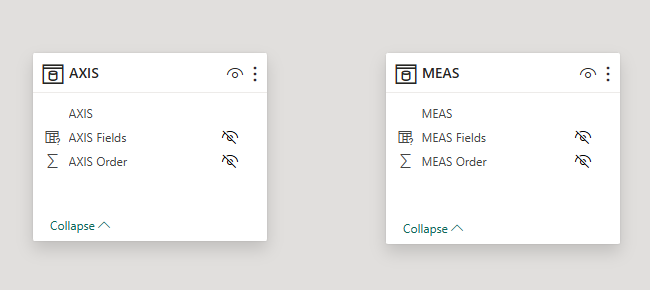
We can only do that because, if you notice closely, Field Parameters are set as tables on the data model:
Fig 3: Field Parameters as tables on the data model.
Now, once they are tables, we can leverage the native ability of Power BI Engine to transverse relationships and move filters from one table to another. In order to explain this behavior better, let’s consider the following scenario:
We’re creating a report in which we want to be able to see the variance of our sales. The variance should be analyzed in two different ways
Sales Managers: we need to show the Month over Month (MoM) variance.
Sales Supervisors: show the Week over Week (WoW) variance.
Based on this requirement, a very straightforward (and old, but still used) way to do it is creating two charts, one weekly based with the weekly variance and the other monthly based with the monthly variance. Once both are done, we have to place one on top of the other and swap them using bookmarks. Well, if you’re already on the road for a while, you might know how tricky working with bookmarks can be.
Now, instead of using bookmarks, we can use Field Parameters connected to a “decision” table, which will select what measure and what axis we want to see on the chart.
First things first, let’s build the two measures for calculating variances:
SALES_MoM =
var _currSales = [SALES_AMOUNT]
var _prevSales = CALCULATE([SALES_AMOUNT],PREVIOUSMONTH(DimDate[Datekey]))
var _result = DIVIDE(_currSales-_prevSales,_prevSales)
RETURN
    _result
SALES_WoW =
VAR _maxSunday = MAX(DimDate[SUNDAY_DATE])
VAR _prevSunday = _maxSunday-7
VAR _currSales = [SALES_AMOUNT]
VAR _prevSales = CALCULATE([SALES_AMOUNT],DimDate[SUNDAY_DATE]=_prevSunday,REMOVEFILTERS(DimDate))
VAR _result = DIVIDE(_currSales-_prevSales,_prevSales)
RETURN
    _result
PS1: there are tons of articles on the web about dealing with Weeks in Power BI (this one and this one from SQLBI are my favorites). In this article, to make things easier, we’re just going to consider that the week goes from Monday to Sunday, and what defines a week is only the Sunday date (which is a column placed on our Date Table).
PS2: measures we’re created assuming they will only be used on visuals containing the month or week/sunday reference. That said, we’re not applying any protections around them.
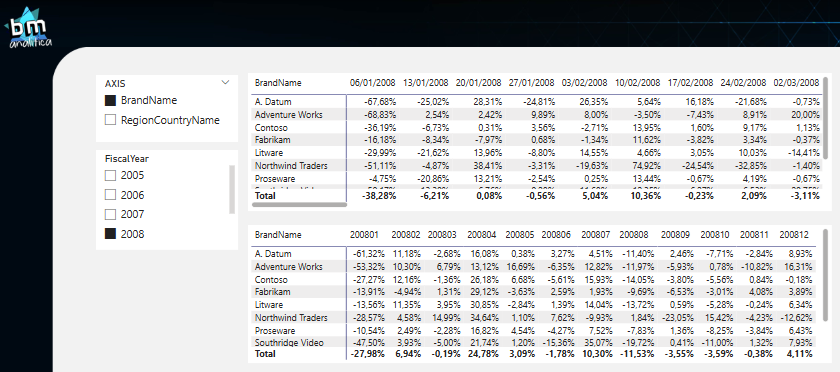
All right, testing both measures, each one with its own column for aggregation (the month and Sunday), we can see the result below:
Fig 5: Checking measures Month over Month (MoM - bottom table) and Week over Week (WoW - top table).
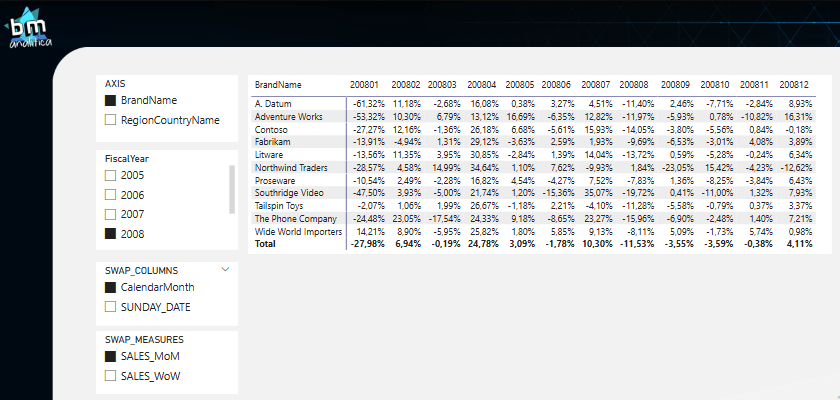
Our main idea now is to create of way to use just one Matrix visual and swapping both columns (the aggregation) and measures at the same time. For this, let’s start creating two field parameters, one for the column and another for the measures:
Fig 6: Fields Parameter for measures and columns.
As you can see, picking the “CalendarMonth” on the SWAP_COLUMNS Field Parameter and picking the “SALES_MoM” on the SWAP_MEASURES Field Parameter will give to us the same result. For sure, we could stop here and just train users on how to pick the right combination on the slicers, but let’s be honest, this is not user friendly and definitely will generate more questions that in the end will jeopardize your report.
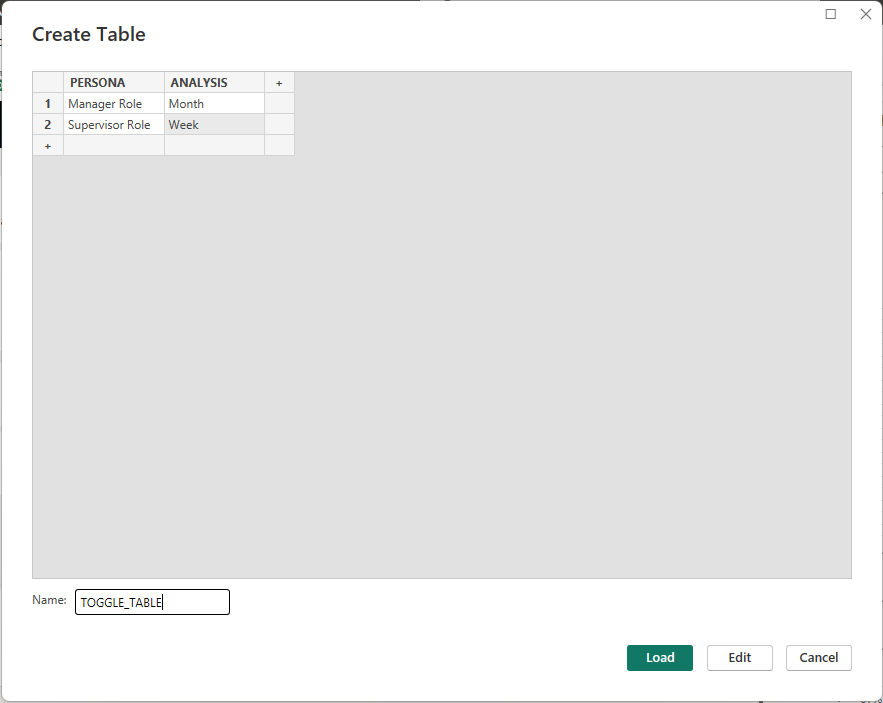
To make things easier, let’s remember that Field Parameters are a special type of table sitting on our data model, which can be connected to other tables by relationships. By leveraging this behavior, we can create a “toggle table”, which will be used as a selector for these two field parameters: picking the monthly analysis or the weekly one. Remembering that we want Managers to check the monthly numbers and supervisors to check the weekly, we can come up with the following “toggle table”:
Fig 7: Toggle table
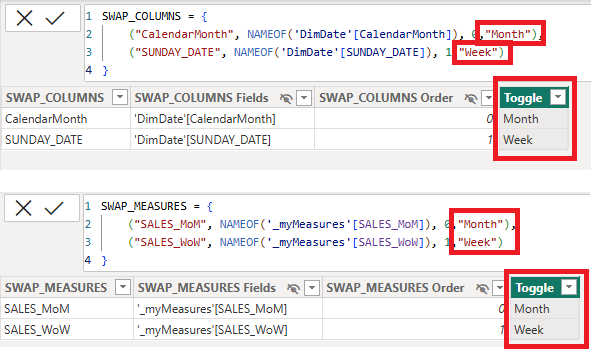
Now, we can adjust the Field Parameters, creating more columns on the auto-tables created when we set them. We must do this on both Field Parameters, associating correctly which fields are used for the Month and Week analysis. This can be easily done just by adding those on the code of the table definition itself:
Fig 8: Extending columns on the Field Parameters.
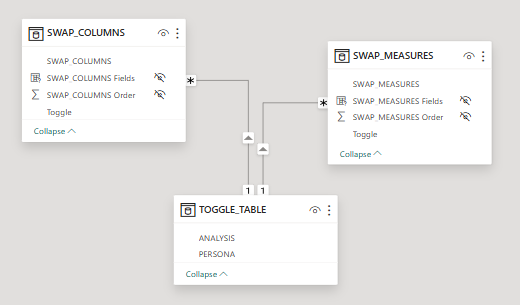
Once the Field Parameters and the Toggle Table are setup, we can build the relationships as following:
Fig 9: Connecting the Toggle Table to the Field Parameter tables.
To test our solution, we can switch the two field parameters slicers on the report canvas for only the one coming from the Toggle Table:
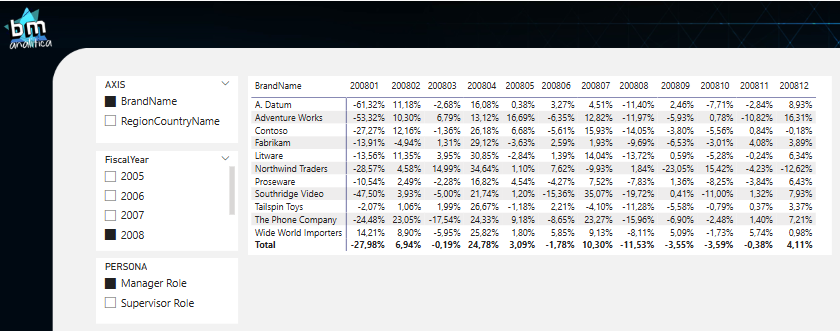
Fig 10: Manager view test.
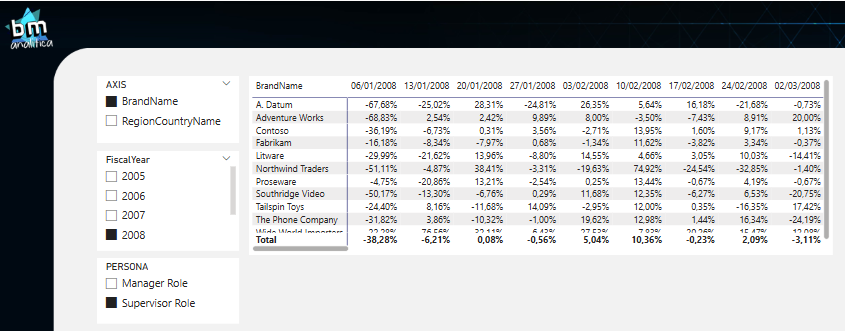
Fig 11: Supervisor view test.
As we can see, depending on the Persona selected on the slicer, the field parameters will be selected on the backend which will swap them on the table, making this a very flexible and easy maintainable approach for changing both measures and aggregation columns.
Conclusion
In this article we covered a very easy and simple way to swap columns and measures and the same time by extending the Field Parameters feature. This approach reduces a lot the burden of maintaining bookmarks and increases the user experience. I’d say it’s a win-win pattern for Power BI!
Well well well, that’s all for today folks!
Cheers!
João Martins
Have this article helped you and wanna appreciate it? Check below how to do that!