
The Date Table is one of the most important tables in a Power BI model. Yet being a simple table, not using it can cause some hidden issues.
Once the Date Table is used to slice and dice and also to aggregate data over a period, you can directly associate this table as being a dimension, connected with all fact tables present in the model.
Also, in order to perform “Time Intelligence” calculations (using DAX functions like DATESMTD, SAMEPERIODLASTYEAR, DATESYTD) we must have a date table on our model which has the day as the table key (i.e., one day per row with no duplicates – unique values). The importance of
this drives from the way the VertiPaq Engine will scan the date table and generate the date windows to build the right filter context to evaluate a specific metric.
However, one can say: “we don’t have any date table in our model but we still can use the DATESMTD()”.
Yeah, that might be true once Power BI has a pre-set feature called “Auto Date/Time” which generates, behind the scenes, for each column of the type “Date” or “Date/Time”, a table containing a calendar. If one doesn’t pay enough attention to this, the feature will have a very critical impact on
your model once it can create hidden tables that will occupy a huge space in memory, causing some performance issues.
Let’s explore this with 2 scenarios demonstrated below. On both, we have a small sales table (only with 5 rows).
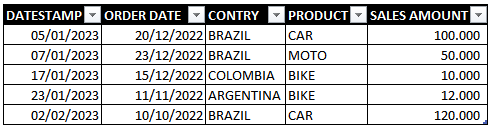
In this first example, the “Auto Date/Time” is enabled. In a “usual” scenario, in which all the records on the date column are filled with normal values for a date, this wouldn’t cause any big issues.
The only problem is in the case of having many “Dates Columns” on the tables loaded in the model. This will generate a lot of “Date Tables” (for each of those columns).
There are two ways you can check if this is happening on your model. The first one is simply looking at the icon in front of the name of the date column directly in Power BI. If it has a small calendar icon in front of it, then behind the scenes, Power BI is creating a Calendar table attached to that column.
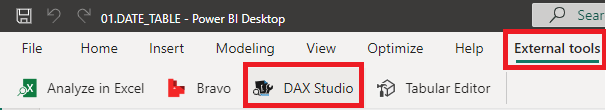
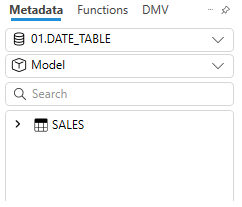
Another way is using DAX Studio. After installed in your machine, we can use the “External Tools” ribbon to launch the app connected to our model. After launched it, at the left, we can see all the tables loaded in the model. As one can see, there is a few tables named “LocalDateTable_xxxxx” that we cannot access/view in our model in Power BI Desktop but still are present on it.
However, this scenario has potential to become problematic, mainly if we’ve got any problem with the records containing our dates, like “01/01/0000” or “01/01/9999”. This is common to appear on a few databases and applications, meaning that there’s still no data for that particular record.
This can become chaotic because, behind the scenes, this “Date Table” generated for that Date Column, read the MIN() and MAX() dates from the column and the spans it to generate a “Calendar Table” from the MIN up to the MAX. Thus, having in the same column, a date “01/01/0001” (or blank) and another “01/01/9999” can create a HUGE hidden table.
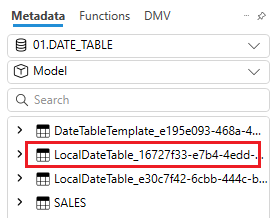
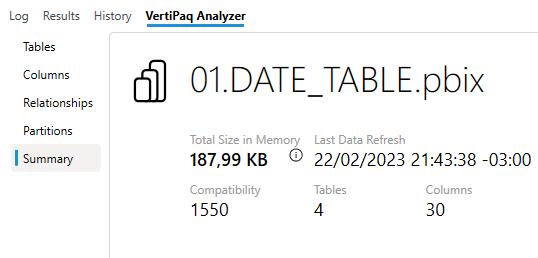
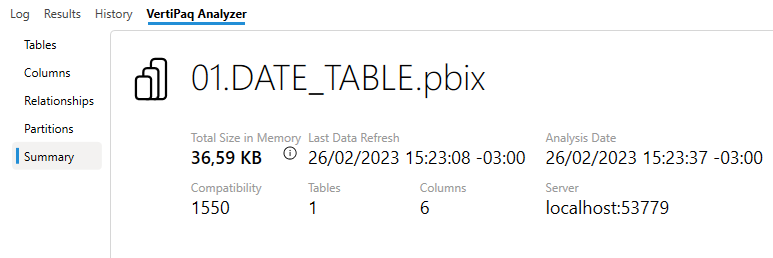
To check this happening, let’s first measure our model size using DAX Studio. In order to do that, let’s go to the “Advanced” tab, and then click on “View Metrics”:
Then, at the bottom, we can select “Summary” to check the size of our model:
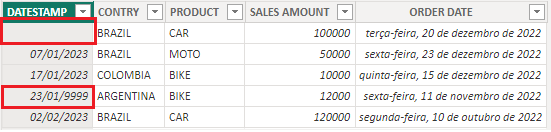
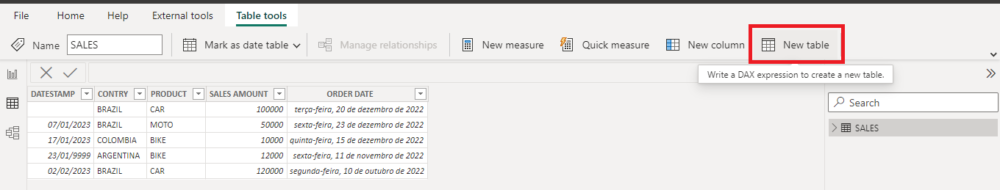
Now, let’s simulate the issue in our Sales Table by changing one correct date for blank and another for the year 9999:
Running again the Summary for the model, we can check the increased size of the memory allocated to it:
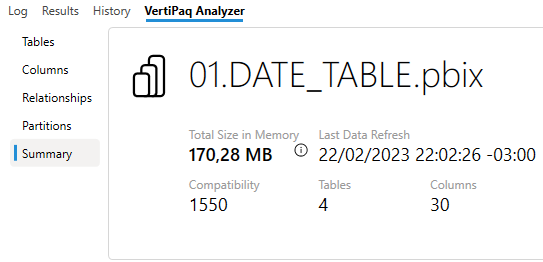
As we can see, the model size increased for only 183KB to 170MB, a proxy of 100x for a 5 rows table!! Now, just imagine having many more “Dates Columns” spread all over a few fact tables on your model, this can become catastrophic for the model performance.
The solution for all these problems: using a central Date Table and disable the auto-creation of hidden calendars.
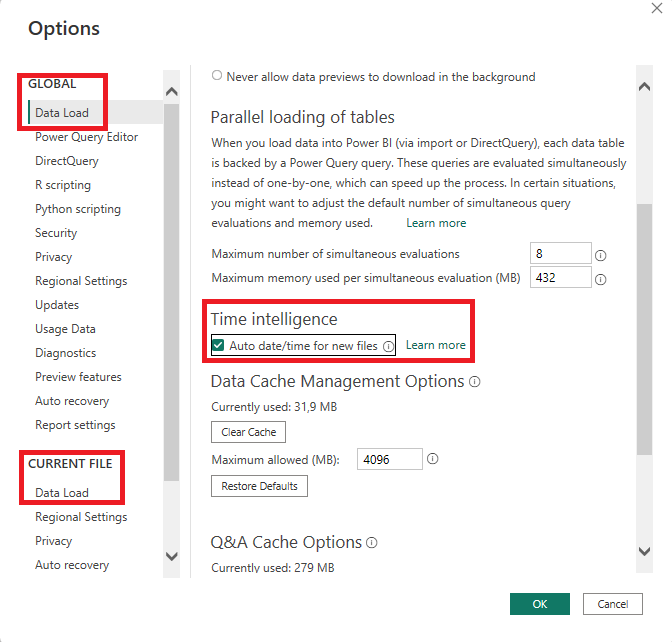
First, let’s disable the “Auto Date/Time”. To do that, we can go to File > Options and settings > Options. We can disable this feature in two ways: only for the current file or in a global perspective, i.e., any new file will have already the feature disabled. For both options, we can go to the “Data Load” tab and then uncheck the “Auto Date/Time” box:
Once this is made, we can already check again the Model Metrics using DAX Studio. As you can see, the hidden date tables are already gone:
Then, we can check the metrics again:
As you can see, the model size just returned to a much smaller size.
However, removing the hidden calendar tables could affect the way we write “Time Intelligence” measures. To overcome the issue, we need to provide a Central Date Table. There are many ways of creating a Date Table for your model. A few options are:
- Building in DAX (this article can help or you can use Bravo to build it for you)
- Building in Power Query (this article may help you)
- Importing for a Data Warehouse (I’ve already implemented this pattern and it works very well)
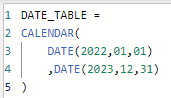
There are pros and cons for each of those options. For the purposes of this article, let’s create it using DAX. To do that, we can go to the Data View and click on “New Table”. Thus, we can just paste the following DAX Code:
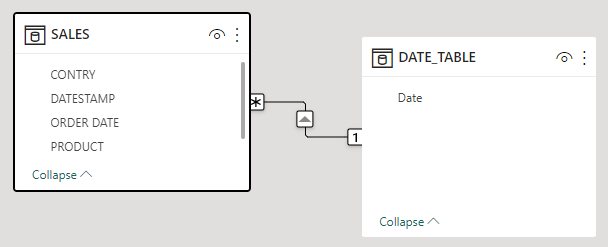
As you can remember, for a date table, we must guarantee that the column containing the dates will have unique values. Once this is done, we can then connect the Date Table to our Fact Table:
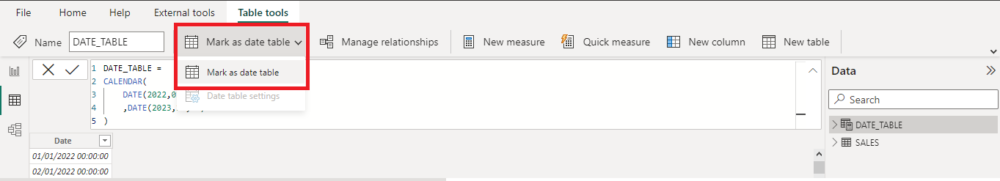
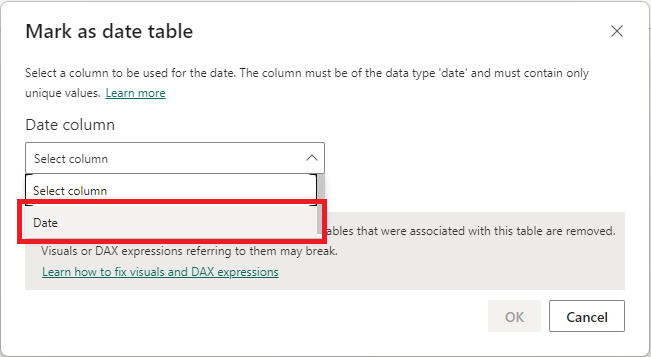
To finish our Date Table setup, a very important step is, after uploading the Date Table, mark it as being a “Date Table” (the Power BI will not know if it is a Date Table or only another Dimension). By doing this, the engine will know how to build the query plan when using the Time Intelligence DAX Functions. To do that, let’s go to the Data View, select the table, then click on “Mark as date table” option and select the column which contains the unique values for the dates:
After doing that, we must guarantee that all the measures created with a “Time Intelligence” purposes are going to use this table to capture the calendar. We also need to guarantee that, in any visual/slicer using dates to slice and dice (or any aspect of the date hierarchy year/month/day), we’re using the columns coming from this Date Table.